
Req ANN Model Demo#
Essential Libraries#
import numpy as np
import pandas as pd
import matplotlib.pyplot as plt
from matplotlib import rc
rc('mathtext', fontset='cm')
from typing import Tuple, Dict, List
from IPython.display import display, Latex
from sklearn.metrics import explained_variance_score, max_error, mean_absolute_error,  mean_squared_error, r2_score, mean_absolute_percentage_error


import torch
import torch.nn as nn
import torch.optim as optim
from torch.utils.data import DataLoader, TensorDataset
import torchvision
import torchmetrics, mlxtend

import torchinfo
from torchinfo import summary

import os
import re
import time
Set the device: cuda or cpu#
device = torch.device('cuda:0' if torch.cuda.is_available() else 'cpu')

if torch.cuda.is_available():
    torch.cuda.set_device(device)
Get the data and create some useful features as extensions#
Min and max values of stellar parameters#
C_min = 0.08763469; C_max = 0.30751308;
Mbar_min = 0.909338; Mbar_max = 2.80912;
Rbar_min = 9.93864; Rbar_max = 19.4138;
x_min = 0.1406481; x_max = 0.78176399;
Ibar_min = 4.73725112; Ibar_max = 33.86946319;
D_min = 0.0046990783; D_max = 0.0335965469;
Qbar_min = 1.31339211; Qbar_max = 14.74045551;
logQbar_min = 0.27261318; logQbar_max = 2.69059579;
S3bar_min = 1.73639896; S3bar_max = 32.10634011;
min-max scaling#
min_values = np.array([Mbar_min, x_min, Qbar_min, S3bar_min])
max_values = np.array([Mbar_max, x_max, Qbar_max, S3bar_max])

# min-max scaling function
feature_scaler = lambda data: (data - min_values) / (max_values - min_values)
Input layer features: model’s input parameters#
selected_features = ['M','x','Qbar','S3bar']
Test subample of NS configurations#
df_test = pd.read_csv("NS_data/test_data_small_sample.csv")
df_test
| M | Req | C | x | Ibar | D | Qbar | log(Qbar) | S3bar | EoS | |
|---|---|---|---|---|---|---|---|---|---|---|
| 0 | 2.190950 | 11.9662 | 0.270131 | 0.166659 | 5.928471 | 0.026846 | 1.935722 | 0.660480 | 3.089488 | SK272 |
| 1 | 1.348410 | 18.3103 | 0.108649 | 0.731341 | 22.361405 | 0.007117 | 7.033574 | 1.950695 | 15.180773 | SKI2 |
| 2 | 2.140930 | 15.1489 | 0.208506 | 0.552628 | 8.784199 | 0.018118 | 2.831782 | 1.040906 | 5.118462 | DD2_2 |
| 3 | 0.990131 | 13.9583 | 0.104655 | 0.387451 | 28.397753 | 0.005605 | 11.565086 | 2.447991 | 24.845141 | DS_CMF-4-Hybr |
| 4 | 1.620250 | 14.0746 | 0.169841 | 0.371895 | 12.573800 | 0.012658 | 4.981185 | 1.605668 | 9.990400 | DS_CMF-8-Hybr |
| ... | ... | ... | ... | ... | ... | ... | ... | ... | ... | ... |
| 397 | 2.200120 | 10.8028 | 0.300475 | 0.297565 | 5.216579 | 0.030509 | 1.544497 | 0.434698 | 2.207297 | BSK26 |
| 398 | 1.972780 | 16.0701 | 0.181116 | 0.655830 | 10.062797 | 0.015816 | 3.133462 | 1.142139 | 6.054977 | Rs |
| 399 | 2.033340 | 13.9065 | 0.215719 | 0.632598 | 7.410619 | 0.021477 | 2.206460 | 0.791389 | 3.821924 | KDE0v1 |
| 400 | 1.142140 | 15.3272 | 0.109939 | 0.565663 | 23.094069 | 0.006892 | 8.345383 | 2.121708 | 17.784955 | PCSB1 |
| 401 | 2.333130 | 14.6437 | 0.235064 | 0.653575 | 6.613759 | 0.024064 | 1.899356 | 0.641515 | 3.077256 | RMF3 |
402 rows × 10 columns
def load_stars(data_frame, batch_size = 2048, shuffle = True):


    df_target = (data_frame['Req'])
    np_features = data_frame[selected_features].to_numpy()

    np_targets = df_target.to_numpy()
    np_targets = np.reshape(np_targets, (np_targets.shape[0], 1))

    tensor_features = torch.Tensor(feature_scaler(np_features))

    input_dimension = tensor_features.shape[1]

    tensor_targets = torch.Tensor(np_targets)
    final_dataset = TensorDataset(tensor_features, tensor_targets)

    dataloader = DataLoader(final_dataset, batch_size=batch_size, shuffle=shuffle, num_workers=5, pin_memory=True)

    return dataloader, input_dimension, np_features, np_targets
Dataloader#
batch_size = 256
test_dataloader, input_dimension, _, _ = load_stars(df_test, batch_size = batch_size)
Feed-forward ANN Model to perform regression#
class ModifiedSigmoid(nn.Module):
    def forward(self, x):
        return Rbar_min + (Rbar_max - Rbar_min)*torch.sigmoid(x)
class RegressorModel(nn.Module):
    def __init__(self,input_dimension, feature_scaler):
        super().__init__()

        self.feature_scaler = feature_scaler

        self.MLP = nn.Sequential(

            nn.Linear(input_dimension, 120),
            nn.GELU(),
            nn.Linear(120, 75),
            nn.GELU(),
            nn.Linear(75, 50),
            nn.GELU(),
            nn.Linear(50, 25),
            nn.GELU(),
            nn.Linear(25, 10),
            nn.GELU(),
            nn.Linear(10, 1),
            ModifiedSigmoid(), # a modification of sigmoid activation function
        )
        # Initialize weights
        for m in self.modules():
            if isinstance(m, nn.Linear):
                nn.init.xavier_uniform_(m.weight)
                nn.init.constant_(m.bias, 0.01)

    def forward(self, x):
        x = self.MLP(x)
        return x

    def predict(self, x):
        x = self.feature_scaler(x).astype('float32')
        x = torch.from_numpy(x).to(self.device)
        x = self.MLP(x)
        x = x.cpu().detach().numpy()
        return x

    def set_device(self, device):
        self.device = device
model_0 = RegressorModel(input_dimension = input_dimension, feature_scaler = feature_scaler)
model_0
RegressorModel(
  (MLP): Sequential(
    (0): Linear(in_features=4, out_features=120, bias=True)
    (1): GELU(approximate='none')
    (2): Linear(in_features=120, out_features=75, bias=True)
    (3): GELU(approximate='none')
    (4): Linear(in_features=75, out_features=50, bias=True)
    (5): GELU(approximate='none')
    (6): Linear(in_features=50, out_features=25, bias=True)
    (7): GELU(approximate='none')
    (8): Linear(in_features=25, out_features=10, bias=True)
    (9): GELU(approximate='none')
    (10): Linear(in_features=10, out_features=1, bias=True)
    (11): ModifiedSigmoid()
  )
)
summary(model_0)
=================================================================
Layer (type:depth-idx)                   Param #
=================================================================
RegressorModel                           --
├─Sequential: 1-1                        --
│    └─Linear: 2-1                       600
│    └─GELU: 2-2                         --
│    └─Linear: 2-3                       9,075
│    └─GELU: 2-4                         --
│    └─Linear: 2-5                       3,800
│    └─GELU: 2-6                         --
│    └─Linear: 2-7                       1,275
│    └─GELU: 2-8                         --
│    └─Linear: 2-9                       260
│    └─GELU: 2-10                        --
│    └─Linear: 2-11                      11
│    └─ModifiedSigmoid: 2-12             --
=================================================================
Total params: 15,021
Trainable params: 15,021
Non-trainable params: 0
=================================================================
ANN Model evaluation#
Load the trained Model best weights \(\theta^\star\)#
batch_size = 256
model_path = './Model-Weights/Req_inference/model.pth'
dataloader_test, _, np_features_test, np_targets_test = load_stars(df_test, batch_size=batch_size)
regressor = RegressorModel(input_dimension = input_dimension, feature_scaler = feature_scaler).to(device)
regressor.set_device(device)
regressor.load_state_dict(torch.load(model_path, map_location=torch.device(device)))
regressor.eval()
RegressorModel(
  (MLP): Sequential(
    (0): Linear(in_features=4, out_features=120, bias=True)
    (1): GELU(approximate='none')
    (2): Linear(in_features=120, out_features=75, bias=True)
    (3): GELU(approximate='none')
    (4): Linear(in_features=75, out_features=50, bias=True)
    (5): GELU(approximate='none')
    (6): Linear(in_features=50, out_features=25, bias=True)
    (7): GELU(approximate='none')
    (8): Linear(in_features=25, out_features=10, bias=True)
    (9): GELU(approximate='none')
    (10): Linear(in_features=10, out_features=1, bias=True)
    (11): ModifiedSigmoid()
  )
)
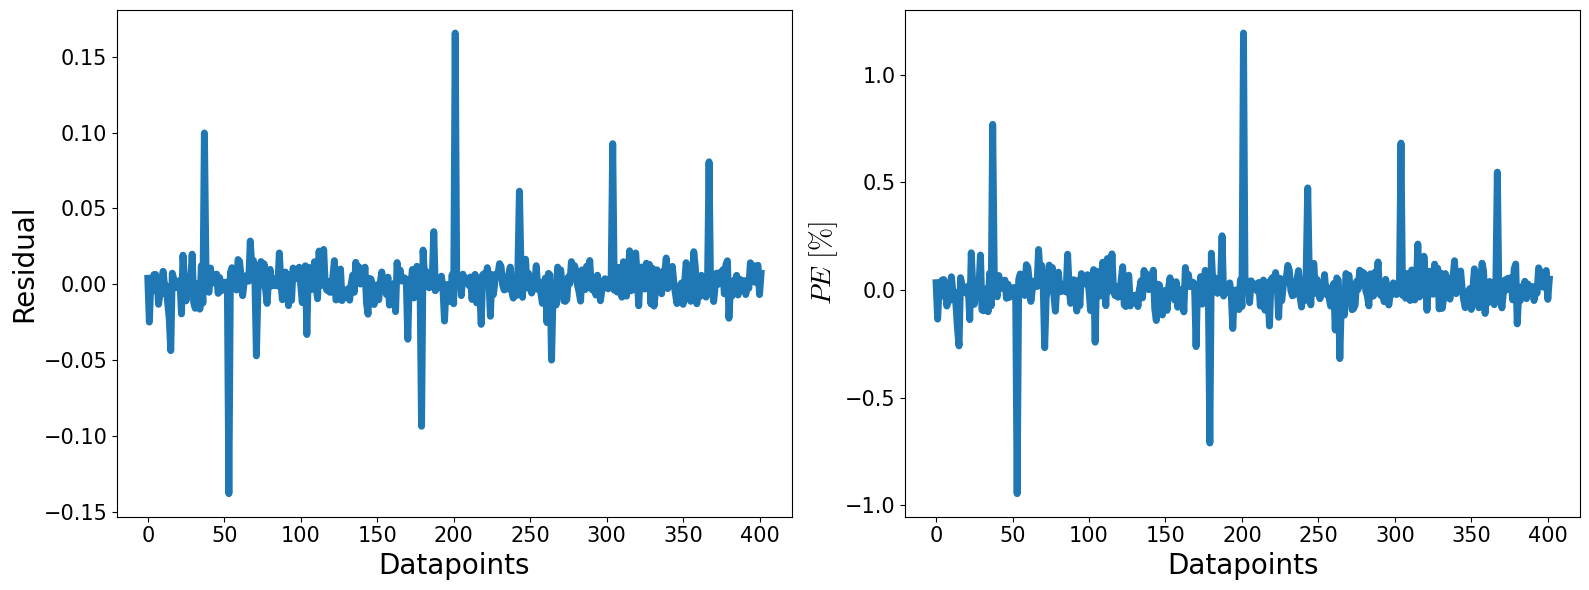
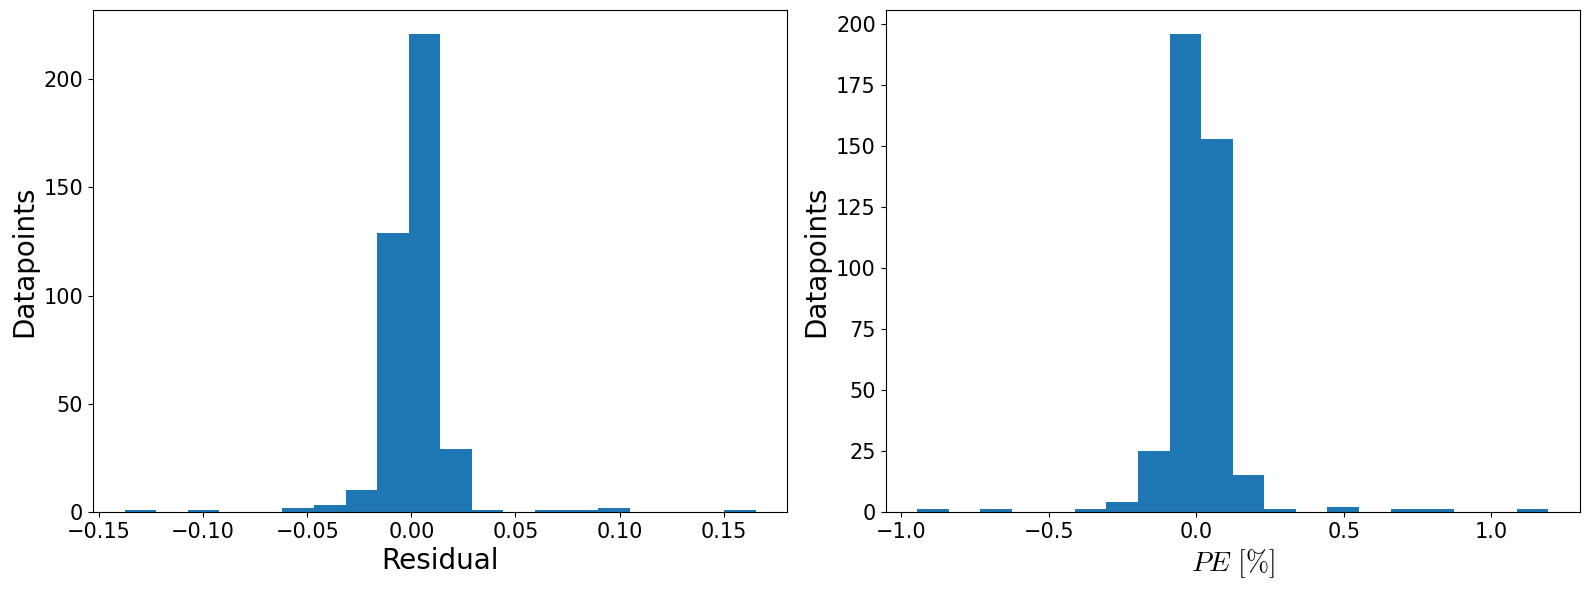
Residual Error - Fractional difference - Evaluation Measures#
def plot_residuals(residual_error, percentage_error):
    witdh, height = 16, 6
    fontsize = 20
    labelsize = 15
    lw = 5

    fig, ax = plt.subplots(1, 2, figsize=(witdh, height))
    # Residual error subplot
    ax[0].plot(residual_error, lw=lw)
    ax[0].set_xlabel(r'Datapoints', fontsize=fontsize)
    ax[0].set_ylabel(r'Residual', fontsize=fontsize)
    ax[0].tick_params(axis='both', which='both', labelsize=labelsize)

    # Percentage error subplot
    ax[1].plot(percentage_error, lw=lw)
    ax[1].set_xlabel(r'Datapoints', fontsize=fontsize)
    ax[1].set_ylabel(r'$PE \ [\%]$', fontsize=fontsize)
    ax[1].tick_params(axis='both', which='both', labelsize=labelsize)

    plt.tight_layout()
    plt.show()

    fig, ax = plt.subplots(1, 2, figsize=(16, 6))
    fontsize = 20
    labelsize = 15
    lw = 5

    # Residual error histogram
    ax[0].hist(residual_error, bins = 20)
    ax[0].set_ylabel(r'Datapoints', fontsize=fontsize)
    ax[0].set_xlabel(r'Residual', fontsize=fontsize)
    ax[0].tick_params(axis='both', which='both', labelsize=labelsize)

    # Percentage error histogram
    ax[1].hist(percentage_error, bins = 20)
    ax[1].set_ylabel(r'Datapoints', fontsize=fontsize)
    ax[1].set_xlabel(r'$PE \ [\%]$', fontsize=fontsize)
    ax[1].tick_params(axis='both', which='both', labelsize=labelsize)

    plt.tight_layout()
    plt.show()
def Evaluation_Measures(y_true, y_pred):

    exp_var = explained_variance_score(y_true, y_pred)
    max_err = max_error(y_true, y_pred)
    mae = mean_absolute_error(y_true, y_pred)
    mse = mean_squared_error(y_true, y_pred)
    r2 = r2_score(y_true, y_pred)
    mape = mean_absolute_percentage_error(y_true, y_pred)

    measures = {'explained_variance': [exp_var],
                'max_error': [max_err],
                'mean_absolute_error': [mae],
                'mean_squared_error': [mse],
                'r2_score': [r2],
                'mean_absolute_percentage_error': [mape]}

    df_eval_measures = pd.DataFrame(measures)

    return df_eval_measures
Evaluation measures in Test Set subsample#
np_targets_test = np_targets_test.ravel()

model_estimation_test_set = regressor.predict(np_features_test)
model_estimation_test_set = model_estimation_test_set.ravel().astype(np.float64)
test_eval_measures = Evaluation_Measures(y_true = np_targets_test, y_pred = model_estimation_test_set)
test_eval_measures
| explained_variance | max_error | mean_absolute_error | mean_squared_error | r2_score | mean_absolute_percentage_error | |
|---|---|---|---|---|---|---|
| 0 | 0.999865 | 0.165519 | 0.009203 | 0.000312 | 0.999865 | 0.000656 |
Redidual Errors and Pecentange Errors in the test Set subsample#
residual_error_test = model_estimation_test_set - np_targets_test
percentage_error_test = (residual_error_test / np_targets_test) * 100
plot_residuals(residual_error_test, percentage_error_test)
df_test['Req_model'] = model_estimation_test_set
df_test['Req_model']
0      11.970228
1      18.285517
2      15.150988
3      13.954027
4      14.081082
         ...
397    10.804200
398    16.082394
399    13.919081
400    15.320505
401    14.651020
Name: Req_model, Length: 402, dtype: float64
def Req_ANN_model(x,y,w,q):
    input_features = np.column_stack((x, y, w, q))
    ANN_estimation = regressor.predict(input_features)
    ANN_estimation = ANN_estimation.ravel().astype(np.float64)
    return ANN_estimation.reshape(x.shape)
Req_ANN_model(df_test['M'], df_test['x'], df_test['Qbar'], df_test['S3bar'])
array([11.9702282 , 18.28551674, 15.15098763, 13.95402718, 14.08108234,
       13.65462685, 14.28729439, 17.5025444 , 14.23970032, 12.98548222,
       14.10595322, 14.32709885, 11.78724289, 17.35937119, 12.45589638,
       16.73633003, 12.98370266, 16.04118538, 16.15984726, 16.14107323,
       14.91732979, 15.27522945, 14.0968895 , 11.17155933, 12.87482357,
       16.26917839, 14.97038269, 15.1282177 , 12.45749664, 12.29862881,
       12.84693146, 16.24530029, 16.71020889, 12.94817543, 16.08102417,
       15.6916523 , 16.528862  , 13.06231499, 13.83004189, 14.49293613,
       16.37824249, 16.08660889, 12.45251083, 13.1664753 , 12.65097809,
       14.87479782, 15.20662117, 16.8719101 , 12.45483208, 14.80629826,
       15.41075039, 12.32093048, 15.00211239, 14.42233467, 16.47124481,
       14.8215332 , 14.38192749, 13.21577168, 14.18133163, 13.990798  ,
       14.50237846, 14.10243034, 13.93110275, 15.83690071, 13.62246037,
       13.7702713 , 13.34173679, 15.25388241, 14.90260696, 13.8303442 ,
       16.7865448 , 17.48409271, 11.70808792, 11.60102081, 13.03515148,
       13.40499306, 13.05932236, 14.53539085, 12.69960403, 14.11511612,
       11.98072147, 12.22959137, 14.04323959, 15.11436653, 14.71528625,
       11.97750378, 12.49452782, 13.37299347, 16.12674904, 16.21629143,
       17.08855057, 14.26700687, 14.25304031, 14.60011482, 14.38139153,
       14.22509766, 15.55151463, 15.56646347, 13.73576069, 16.02823448,
       15.90948296, 12.47553253, 14.46525955, 12.9901762 , 13.55373955,
       13.05022049, 14.69259834, 12.14721107, 14.59520054, 11.5985508 ,
       12.97085667, 12.93478012, 15.08218193, 15.18281078, 17.48441696,
       13.76404762, 13.05204582, 14.42875481, 11.86363888, 15.38533401,
       17.37732697, 11.79440403, 14.49766064, 14.78270054, 12.80805016,
       13.62837696, 14.77804375, 14.31617546, 16.83944702, 15.04204178,
       14.56480217, 12.46836853, 13.47963047, 13.49839401, 14.4474411 ,
       14.19802952, 16.05585098, 12.47523594, 15.99821663, 13.88773251,
       12.91431999, 15.16233921, 12.38267422, 13.70915318, 13.80518532,
       14.88559914, 14.57726765, 14.00338745, 11.36788654, 13.87422848,
       12.82187176, 10.66827679, 13.80076599, 14.45339012, 12.7399044 ,
       12.72603416, 14.05107021, 12.57341194, 16.93369675, 16.91781616,
       15.30772114, 14.86620712, 17.56640244, 13.80399418, 14.98454857,
       13.20726967, 14.24203396, 16.31357956, 11.85154724, 12.35376835,
       13.68012619, 13.32242584, 14.26872349, 15.86583519, 13.49682426,
       14.50489521, 13.07694817, 14.34861755, 14.00374031, 13.04650211,
       13.27513599, 12.13978767, 14.63252449, 15.26786232, 14.16038513,
       14.15639019, 17.15218163, 13.83475876, 14.65836334, 12.59420204,
       16.32968712, 13.77141953, 16.61725235, 16.86939621, 13.43212032,
       14.35223198, 15.35777664, 16.46629715, 12.43298149, 13.70402718,
       16.55398369, 14.03431892, 13.20050049, 16.89446831, 12.3333416 ,
       12.53121758, 15.9290657 , 14.47356796, 13.83024979, 12.81625462,
       12.42630291, 14.05250168, 13.30090046, 12.53253937, 14.35412121,
       12.95116711, 11.96795177, 15.7085762 , 15.71051311, 13.48445511,
       12.43496799, 12.60135174, 13.65763092, 13.25151253, 16.49724579,
       12.21465492, 13.35262299, 12.85219574, 14.47987366, 12.96709824,
       12.01029587, 13.23008919, 12.10257149, 13.30478954, 14.06602573,
       12.68977451, 12.88010311, 12.6727972 , 15.03523636, 11.36349106,
       12.72533798, 14.57727337, 12.4928112 , 13.0070715 , 14.34321022,
       12.28317261, 15.52950001, 13.44430447, 15.9775238 , 14.57107544,
       12.99823093, 13.87891483, 16.24900055, 13.18167591, 17.31325531,
       16.28635406, 14.13051605, 14.62957001, 16.63656616, 13.71230507,
       14.12998772, 13.48978424, 12.99707127, 13.97443962, 15.58039093,
       14.36047173, 14.04219151, 11.55828953, 14.968997  , 14.45600033,
       13.95084763, 12.85087395, 11.70394135, 12.85741234, 14.17959785,
       12.34907246, 17.00716591, 16.34561539, 14.62317753, 15.11683846,
       11.46660709, 14.36273766, 17.7225647 , 14.86302757, 12.84451103,
       13.51258755, 11.9183197 , 14.62186813, 14.48764324, 12.11373997,
       16.33239746, 14.4219141 , 13.37552929, 12.86010838, 12.34879494,
       13.56698036, 15.38667393, 15.56991959, 11.78587818, 11.49649811,
       15.61150932, 13.49601555, 14.52834511, 12.88481808, 13.67485237,
       15.15719986, 12.41550922, 13.33150101, 14.5972805 , 13.04994392,
       17.15661812, 16.09844208, 14.65918159, 16.69577408, 15.76573372,
       10.42569447, 12.72731781, 13.60762787, 16.4707756 , 13.26031971,
       13.497015  , 14.8565588 , 15.82081032, 13.17626858, 14.92021465,
       15.43475342, 11.63096428, 13.35837936, 13.12691784, 14.57987976,
       13.57296753, 16.72515488, 14.39770889, 12.60420609, 12.85842228,
       12.19496822, 14.37318134, 14.86535931, 13.68448639, 12.83331871,
       15.97725773, 12.2897377 , 12.17482948, 13.4801712 , 14.77783966,
       12.80935097, 15.29781818, 15.00509167, 14.72575951, 14.62473965,
       14.47120857, 13.26286983, 14.57270622, 14.00584412, 16.39016724,
       13.46167183, 15.15779877, 17.35774803, 13.05175018, 11.65907574,
       12.28226662, 13.5450325 , 15.26772976, 15.79541016, 14.4079895 ,
       12.20316696, 14.1239357 , 14.82902336, 16.76190758, 13.04648304,
       13.52096176, 12.94268799, 15.90096569, 12.35068035, 14.27921486,
       14.56800842, 16.81552887, 13.58106995, 13.33160686, 12.93594933,
       14.10534668, 13.90659904, 15.30170441, 15.58994865, 11.71979809,
       14.84378052, 17.26174164, 12.72362804, 13.52970123, 14.82021904,
       16.11397934, 13.59493351, 12.80858612, 18.04695892, 13.89805317,
       15.18954468, 14.77378178, 10.80420017, 16.08239365, 13.91908073,
       15.32050514, 14.65102005])
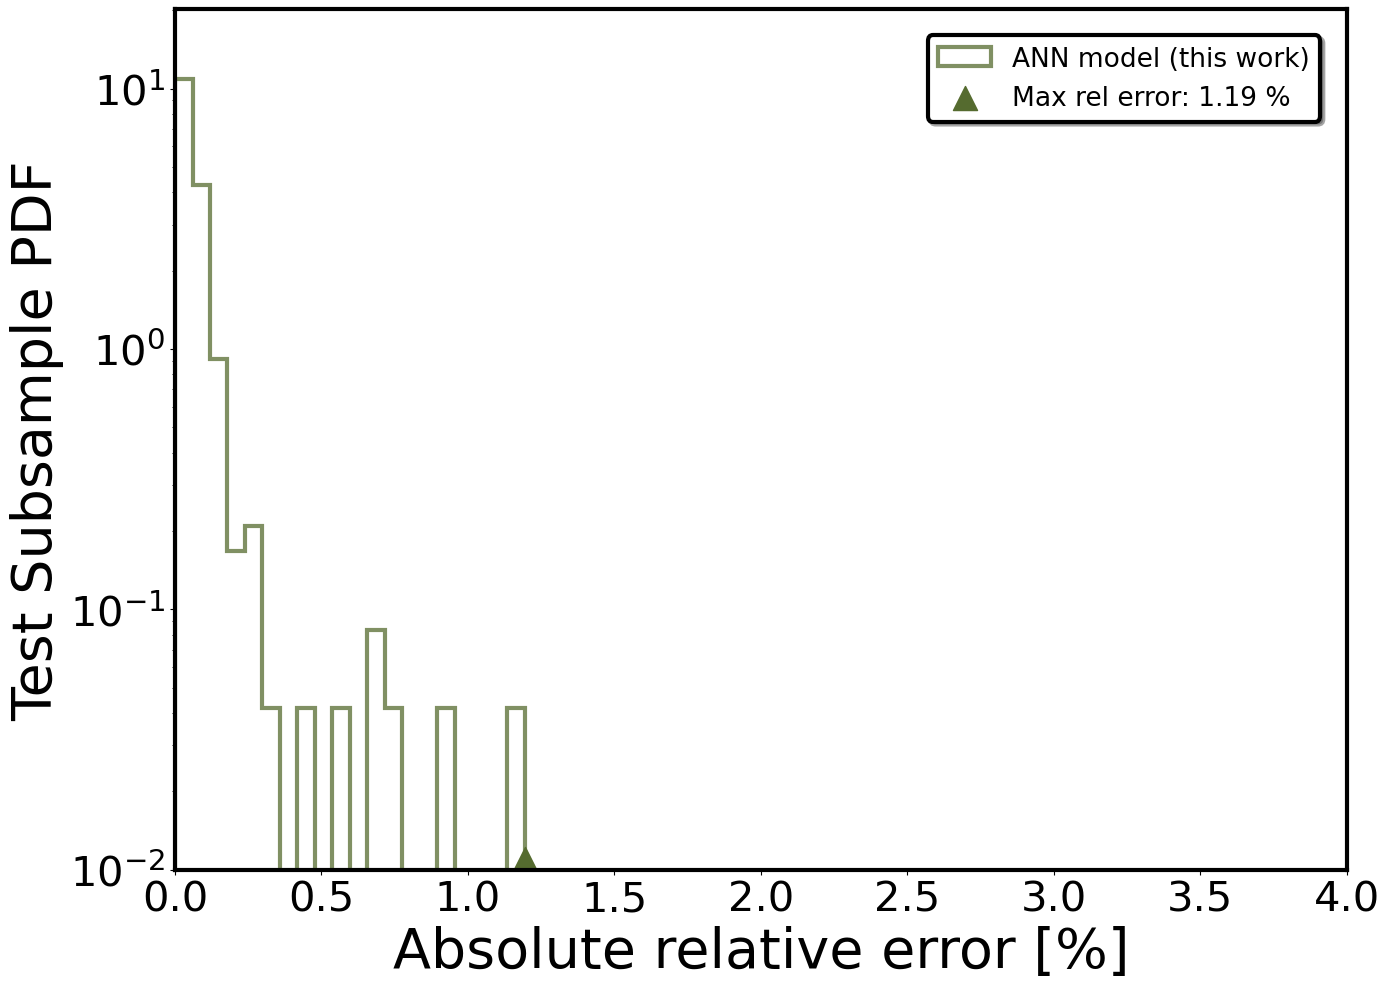
Model’s fractional differences associated with the test set’s subsample#
fig,ax = plt.subplots(figsize=(14, 10),)
labels_text_size = 40
plt.xticks(fontsize=30)
plt.yticks(fontsize=30)

xlabel = r'Absolute relative error [%]'
ylabel = r'Test Subsample PDF'


plt.xlabel(xlabel,size=labels_text_size)
plt.ylabel(ylabel,size=labels_text_size)

bins = 20
alpha = 0.75

density = True

y_reg_model = (np.abs(100*(-df_test['Req'] + df_test['Req_model'])/df_test['Req'])).hist(
    density=density,
    bins=bins,
    lw=3,
    edgecolor='darkolivegreen',
    zorder=1,
    histtype='step',
    alpha=alpha,
    label=f"ANN model (this work)",
    color='darkolivegreen',
    #log = True
).autoscale(enable=True, axis='both', tight=True)

max_deviation = (np.abs(100*(-df_test['Req'] + df_test['Req_model'])/df_test['Req'])).max()

vertical_lines = [max_deviation]

plt.scatter(vertical_lines[0], 1.1e-2, color='darkolivegreen',  marker='^', s=300, zorder=2, label=f'Max rel error: {np.round(max_deviation, 2)} %')  # Star marker

for axis in ['top','bottom','left','right']:
    ax.spines[axis].set_linewidth(3.)


plt.yscale('log')

plt.xlim(0,4.)


plt.ylim(1e-2,20.2)

plt.grid(False)
leg = plt.legend(loc="upper right",ncol=1, borderaxespad=1, prop={'size': 19}, shadow=True, fontsize="large")    #,bbox_to_anchor=(1,1)
leg.get_frame().set_linewidth(3.0)
leg.get_frame().set_edgecolor('black')

plt.tight_layout()
plt.show()