

Inspect an HDF5 noise file#
AresGW ACME training session#
Nikolaos Stergioulas
Aristotle University of Thessaloniki
1) Setup#
import h5py
import numpy as np
import pandas as pd
import matplotlib.pyplot as plt

HDF_PATH = "real_noise_file.hdf"
2) Open the file and inspect contents#
f = h5py.File(HDF_PATH, "r")
print("Opened:", f.filename)
print("Root keys:", list(f.keys()))
Opened: real_noise_file.hdf
Root keys: ['H1', 'L1']
3) Print the tree (groups/datasets) with shapes and dtypes#
MAX_CHILDREN_TO_PRINT = 4

def _short(value, maxlen=80):
    text = repr(value)
    if len(text) > maxlen:
        return text[: maxlen - 3] + "..."
    return text


def print_hdf5_tree_with_attrs(obj, prefix="", max_depth=7, depth=0, max_children=MAX_CHILDREN_TO_PRINT):
    """Recursively print HDF5 tree with shapes, dtypes, and attributes up to one more depth."""
    if depth > max_depth:
        print(prefix + "… (max depth reached)")
        return

    if isinstance(obj, h5py.File) or isinstance(obj, h5py.Group):
        keys = list(obj.keys())
        if len(keys) > max_children:
            keys = keys[:max_children]
            truncated = True
        else:
            truncated = False

        for name in keys:
            item = obj[name]
            if isinstance(item, h5py.Group):
                print(f"{prefix}{name}/  (Group)  attrs={len(item.attrs)}")
                for k, v in item.attrs.items():
                    print(f"{prefix}  - {k}: {_short(v)}")
                print_hdf5_tree_with_attrs(item, prefix + "  ", max_depth, depth + 1, max_children)
            elif isinstance(item, h5py.Dataset):
                shape = item.shape
                dtype = item.dtype
                print(f"{prefix}{name}  (Dataset) shape={shape}, dtype={dtype}, attrs={len(item.attrs)}")
                for k, v in item.attrs.items():
                    print(f"{prefix}  - {k}: {_short(v)}")
            else:
                print(f"{prefix}{name}  ({type(item)})")

        if truncated:
            print(prefix + f"… ({len(obj.keys()) - max_children} more children not shown)")
    else:
        print(prefix + f"(Unknown object type: {type(obj)})")

print_hdf5_tree_with_attrs(f)
H1/  (Group)  attrs=0
  1238205077  (Dataset) shape=(20604928,), dtype=float32, attrs=2
    - delta_t: np.float64(0.00048828125)
    - start_time: np.float64(1238205077.0)
  1238400368  (Dataset) shape=(22710272,), dtype=float32, attrs=2
    - delta_t: np.float64(0.00048828125)
    - start_time: np.float64(1238400368.0)
  1238546548  (Dataset) shape=(18247680,), dtype=float32, attrs=2
    - delta_t: np.float64(0.00048828125)
    - start_time: np.float64(1238546548.0)
  1238561176  (Dataset) shape=(62007296,), dtype=float32, attrs=2
    - delta_t: np.float64(0.00048828125)
    - start_time: np.float64(1238561176.0)
  … (358 more children not shown)
L1/  (Group)  attrs=0
  1238205077  (Dataset) shape=(20604928,), dtype=float32, attrs=2
    - delta_t: np.float64(0.00048828125)
    - start_time: np.float64(1238205077.0)
  1238400368  (Dataset) shape=(22710272,), dtype=float32, attrs=2
    - delta_t: np.float64(0.00048828125)
    - start_time: np.float64(1238400368.0)
  1238546548  (Dataset) shape=(18247680,), dtype=float32, attrs=2
    - delta_t: np.float64(0.00048828125)
    - start_time: np.float64(1238546548.0)
  1238561176  (Dataset) shape=(62007296,), dtype=float32, attrs=2
    - delta_t: np.float64(0.00048828125)
    - start_time: np.float64(1238561176.0)
  … (358 more children not shown)
3) Build an overview table of segments (start_time, delta_t, samples, duration)#
def segment_summary_for_ifo(ifo):
    if ifo not in f:
        return pd.DataFrame()

    rows = []
    grp = f[ifo]

    for seg_key in grp.keys():
        seg = grp[seg_key]

        # segment-level attrs (preferred)
        start_time = seg.attrs.get("start_time", None)
        delta_t = seg.attrs.get("delta_t", None)

        # find dataset to get length
        ds = None
        ds_path = None

        if isinstance(seg, h5py.Dataset):
            ds = seg
            ds_path = f"/{ifo}/{seg_key}"
        elif isinstance(seg, h5py.Group):
            name, ds = first_dataset_in_group(seg)
            if ds is not None:
                ds_path = f"/{ifo}/{seg_key}/{name}"

        n = None
        if ds is not None and ds.ndim >= 1:
            n = int(ds.shape[0])

        # fallback: if dataset has attrs
        if start_time is None and ds is not None:
            start_time = ds.attrs.get("start_time", None)
        if delta_t is None and ds is not None:
            delta_t = ds.attrs.get("delta_t", None)

        # compute duration if possible
        duration = None
        if delta_t is not None and n is not None:
            try:
                duration = float(delta_t) * n
            except Exception:
                duration = None

        rows.append({
            "ifo": ifo,
            "segment_key": str(seg_key),
            "path": ds_path,
            "start_time": float(start_time) if start_time is not None else np.nan,
            "delta_t": float(delta_t) if delta_t is not None else np.nan,
            "n_samples": n if n is not None else np.nan,
            "duration_s": duration if duration is not None else np.nan
        })

    df = pd.DataFrame(rows)
    # Try to sort by numeric segment_key if possible, else by start_time
    try:
        df["_k"] = df["segment_key"].astype(int)
        df = df.sort_values(["ifo", "_k"]).drop(columns=["_k"])
    except Exception:
        df = df.sort_values(["ifo", "start_time"])
    return df.reset_index(drop=True)

df_H1 = segment_summary_for_ifo("H1")
df_L1 = segment_summary_for_ifo("L1")

df = pd.concat([df_H1, df_L1], ignore_index=True)
display(df.head(20))

print("Counts:")
print(df.groupby("ifo").size())
| ifo | segment_key | path | start_time | delta_t | n_samples | duration_s | |
|---|---|---|---|---|---|---|---|
| 0 | H1 | 1238205077 | /H1/1238205077 | 1.238205e+09 | 0.000488 | 20604928 | 10061.0 |
| 1 | H1 | 1238400368 | /H1/1238400368 | 1.238400e+09 | 0.000488 | 22710272 | 11089.0 |
| 2 | H1 | 1238546548 | /H1/1238546548 | 1.238547e+09 | 0.000488 | 18247680 | 8910.0 |
| 3 | H1 | 1238561176 | /H1/1238561176 | 1.238561e+09 | 0.000488 | 62007296 | 30277.0 |
| 4 | H1 | 1238612625 | /H1/1238612625 | 1.238613e+09 | 0.000488 | 15044608 | 7346.0 |
| 5 | H1 | 1238645908 | /H1/1238645908 | 1.238646e+09 | 0.000488 | 54861824 | 26788.0 |
| 6 | H1 | 1238677592 | /H1/1238677592 | 1.238678e+09 | 0.000488 | 20482048 | 10001.0 |
| 7 | H1 | 1238731472 | /H1/1238731472 | 1.238731e+09 | 0.000488 | 54738944 | 26728.0 |
| 8 | H1 | 1238758280 | /H1/1238758280 | 1.238758e+09 | 0.000488 | 20123648 | 9826.0 |
| 9 | H1 | 1238805513 | /H1/1238805513 | 1.238806e+09 | 0.000488 | 27820032 | 13584.0 |
| 10 | H1 | 1238819847 | /H1/1238819847 | 1.238820e+09 | 0.000488 | 28108800 | 13725.0 |
| 11 | H1 | 1238834634 | /H1/1238834634 | 1.238835e+09 | 0.000488 | 39577600 | 19325.0 |
| 12 | H1 | 1238918966 | /H1/1238918966 | 1.238919e+09 | 0.000488 | 23392256 | 11422.0 |
| 13 | H1 | 1238996844 | /H1/1238996844 | 1.238997e+09 | 0.000488 | 21178368 | 10341.0 |
| 14 | H1 | 1239060175 | /H1/1239060175 | 1.239060e+09 | 0.000488 | 18210816 | 8892.0 |
| 15 | H1 | 1239069672 | /H1/1239069672 | 1.239070e+09 | 0.000488 | 25755648 | 12576.0 |
| 16 | H1 | 1239087144 | /H1/1239087144 | 1.239087e+09 | 0.000488 | 32931840 | 16080.0 |
| 17 | H1 | 1239153852 | /H1/1239153852 | 1.239154e+09 | 0.000488 | 30199808 | 14746.0 |
| 18 | H1 | 1239168627 | /H1/1239168627 | 1.239169e+09 | 0.000488 | 41791488 | 20406.0 |
| 19 | H1 | 1239201475 | /H1/1239201475 | 1.239201e+09 | 0.000488 | 14979072 | 7314.0 |
Counts:
ifo
H1    362
L1    362
dtype: int64
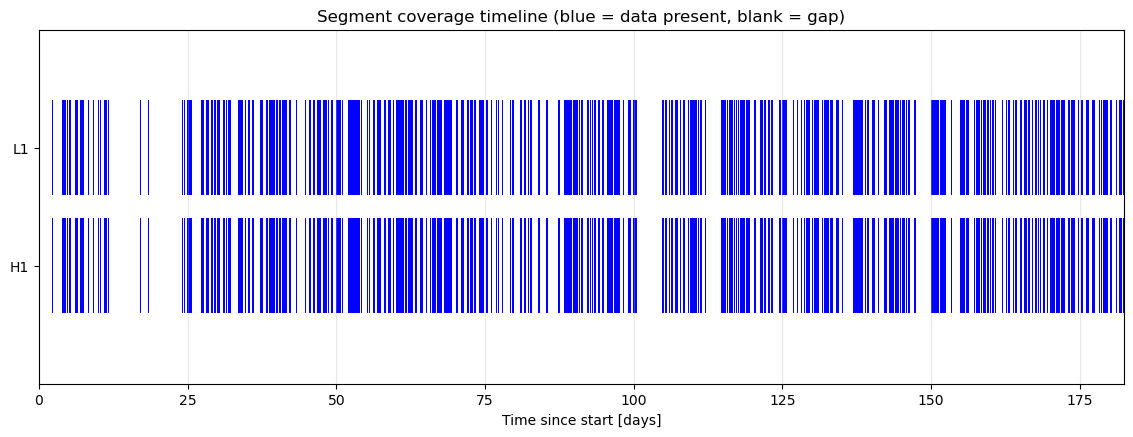
4) DATA COVERAGE AND GAPS#
import numpy as np
import pandas as pd
import matplotlib.pyplot as plt

# If you already have df_H1/df_L1 from earlier cells, great.
# Otherwise, use the combined df you built (or rebuild using your segment_summary_for_ifo()).

def _prep_ifo_df(df_ifo: pd.DataFrame) -> pd.DataFrame:
    """Keep only rows with enough info and compute end_time."""
    d = df_ifo.copy()
    d = d.dropna(subset=["start_time", "delta_t", "n_samples"])
    d["start_time"] = d["start_time"].astype(float)
    d["delta_t"] = d["delta_t"].astype(float)
    d["n_samples"] = d["n_samples"].astype(int)
    d["end_time"] = d["start_time"] + d["delta_t"] * d["n_samples"]
    d = d.sort_values("start_time").reset_index(drop=True)
    return d

def plot_full_timeline(df_H1=None, df_L1=None, df_all=None, unit="days"):
    """
    Plot segment coverage as blue boxes; gaps appear as blank space.

    Provide either:
      - df_H1 and/or df_L1, OR
      - df_all with an 'ifo' column (values like 'H1', 'L1').
    """
    if df_all is None:
        frames = []
        if df_H1 is not None and not df_H1.empty:
            d = df_H1.copy()
            d["ifo"] = "H1"
            frames.append(d)
        if df_L1 is not None and not df_L1.empty:
            d = df_L1.copy()
            d["ifo"] = "L1"
            frames.append(d)
        if not frames:
            raise ValueError("No dataframes provided.")
        df_all = pd.concat(frames, ignore_index=True)

    # Prepare per-IFO
    ifos = sorted(df_all["ifo"].dropna().unique().tolist())
    per = {}
    for ifo in ifos:
        dfi = _prep_ifo_df(df_all[df_all["ifo"] == ifo])
        if not dfi.empty:
            per[ifo] = dfi

    if not per:
        raise RuntimeError("No valid segments found (need start_time, delta_t, n_samples).")

    # Global start/end for x-axis
    t0 = min(d["start_time"].min() for d in per.values())
    t1 = max(d["end_time"].max() for d in per.values())
    span = t1 - t0

    if unit == "seconds":
        scale = 1.0
        xlabel = "Time since start [s]"
    elif unit == "hours":
        scale = 3600.0
        xlabel = "Time since start [hours]"
    else:
        scale = 86400.0
        xlabel = "Time since start [days]"

    fig, ax = plt.subplots(figsize=(14, 3 + 0.8 * len(per)))

    # One horizontal lane per IFO
    lane_height = 0.8
    y_positions = {}
    for i, ifo in enumerate(ifos):
        y_positions[ifo] = i

    for ifo, dfi in per.items():
        y = y_positions[ifo]
        # Convert segments to (start_offset, duration) in requested units
        segs = []
        for st, en in zip(dfi["start_time"].values, dfi["end_time"].values):
            segs.append(((st - t0) / scale, (en - st) / scale))

        # Blue boxes for data coverage (gaps remain blank)
        ax.broken_barh(segs, (y - lane_height / 2, lane_height), facecolors="blue")

    ax.set_ylim(-1, len(ifos))
    ax.set_xlim(0, span / scale)
    ax.set_yticks([y_positions[ifo] for ifo in ifos])
    ax.set_yticklabels(ifos)
    ax.set_xlabel(xlabel)
    ax.set_title("Segment coverage timeline (blue = data present, blank = gap)")
    ax.grid(True, axis="x", alpha=0.3)
    plt.show()

# --- Call it ---
# If you have df_H1/df_L1:
plot_full_timeline(df_H1=df_H1, df_L1=df_L1, unit="days")
5) CALCULATE TOTAL REAL DURATION (EXCLUDING GAPS)#
import pandas as pd

def total_duration_simple(df_ifo: pd.DataFrame) -> float:
    d = df_ifo.dropna(subset=["delta_t", "n_samples"]).copy()
    d["delta_t"] = d["delta_t"].astype(float)
    d["n_samples"] = d["n_samples"].astype(int)
    return float((d["delta_t"] * d["n_samples"]).sum())

# If you have df_H1 and df_L1:
H1_s = total_duration_simple(df_H1) if "df_H1" in globals() else 0.0
L1_s = total_duration_simple(df_L1) if "df_L1" in globals() else 0.0
ALL_s = H1_s + L1_s

print(f"H1 total:  {H1_s:.3f} s  ({H1_s/86400:.6f} days)")
print(f"L1 total:  {L1_s:.3f} s  ({L1_s/86400:.6f} days)")
H1 total:  7111579.000 s  (82.309942 days)
L1 total:  7111579.000 s  (82.309942 days)
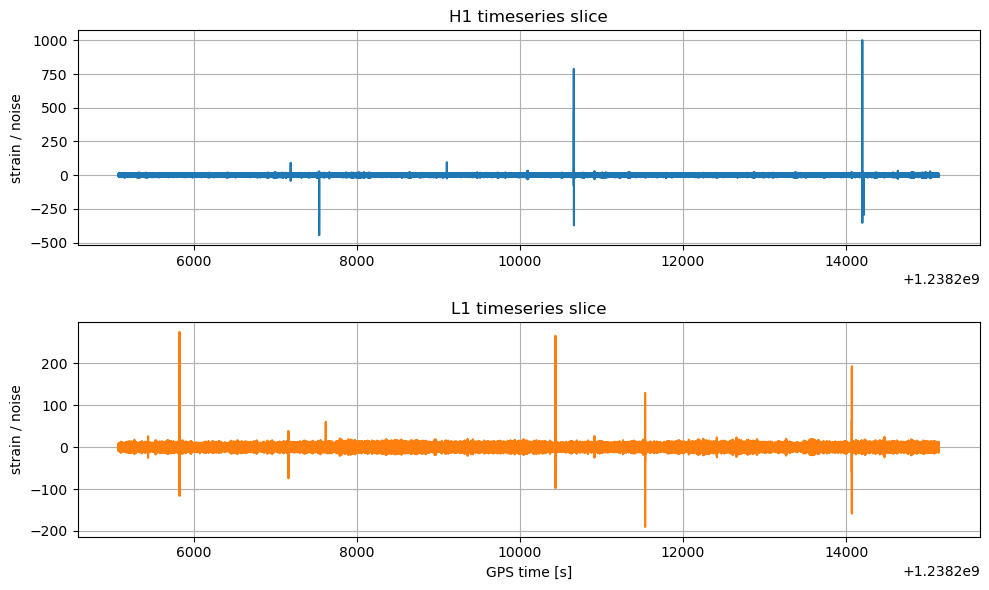
6) VIEW FIRST SEGMENT AS PYCBC TIME SERIES#
import warnings
warnings.filterwarnings("ignore", "Wswiglal-redir-stdio")
import lal
lal.swig_redirect_standard_output_error(False)

from pycbc.types import TimeSeries, load_timeseries


# Get the first valid segment key for a group
def first_existing_child(group):
    if not isinstance(group, h5py.Group):
        return None
    for k in sorted(group.keys(), key=lambda x: int(x) if str(x).isdigit() else str(x)):
        return k
    return None

file_path = HDF_PATH

# Choose IFO and first available segment key automatically
ifo = "H1" if "H1" in f else list(f.keys())[0]
seg_key = first_existing_child(f[ifo])
print(f"Using IFO {ifo}, segment key {seg_key}")

h1_ts = load_timeseries(file_path, group=f'H1/{seg_key}')
l1_ts = load_timeseries(file_path, group=f'L1/{seg_key}')

# Plot the example H1 / L1 timeseries loaded earlier
plt.figure(figsize=(10, 6))

plt.subplot(2, 1, 1)
plt.plot(h1_ts.sample_times, h1_ts, color="C0")
plt.title("H1 timeseries slice")
plt.ylabel("strain / noise")
plt.grid(True)

plt.subplot(2, 1, 2)
plt.plot(l1_ts.sample_times, l1_ts, color="C1")
plt.title("L1 timeseries slice")
plt.xlabel("GPS time [s]")
plt.ylabel("strain / noise")
plt.grid(True)

plt.tight_layout()
plt.show()
Using IFO H1, segment key 1238205077
8) REINSTATE DYNAMIC RANGE FACTOR#
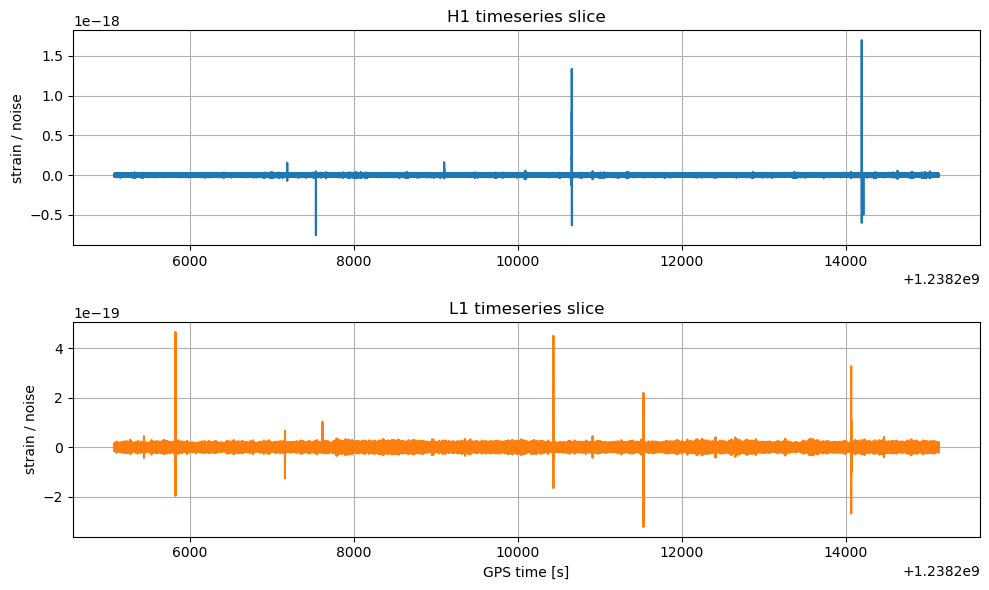
Notice that the MLGWSC-1 data format used in reals_noise_file.hdf assumes that the strain data was multiplie by the factor DYN_RANGE_FAC from pycbc. To recover the actual physical data, we must divide by the same factor.
from pycbc import DYN_RANGE_FAC

h1_ts_scaled = h1_ts
h1_ts = h1_ts_scaled / DYN_RANGE_FAC

l1_ts_scaled = l1_ts
l1_ts = l1_ts_scaled / DYN_RANGE_FAC

plt.figure(figsize=(10, 6))

plt.subplot(2, 1, 1)
plt.plot(h1_ts.sample_times, h1_ts, color="C0")
plt.title("H1 timeseries slice")
plt.ylabel("strain / noise")
plt.grid(True)

plt.subplot(2, 1, 2)
plt.plot(l1_ts.sample_times, l1_ts, color="C1")
plt.title("L1 timeseries slice")
plt.xlabel("GPS time [s]")
plt.ylabel("strain / noise")
plt.grid(True)

plt.tight_layout()
plt.show()
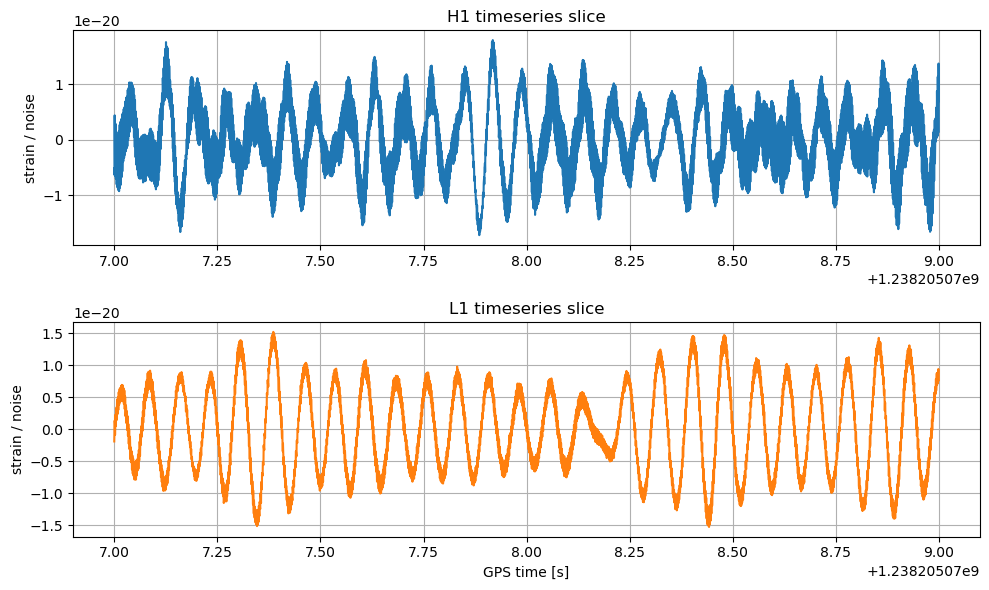
7) INSPECT A SHORT DATA SLICE#
# Plot the first 4096 data points, which is 2 seconds and a sampling rate of 2048Hz

plt.figure(figsize=(10, 6))

plt.subplot(2, 1, 1)
plt.plot(h1_ts.sample_times[:4096], h1_ts[:4096], color="C0")
plt.title("H1 timeseries slice")
plt.ylabel("strain / noise")
plt.grid(True)

plt.subplot(2, 1, 2)
plt.plot(l1_ts.sample_times[:4096], l1_ts[:4096], color="C1")
plt.title("L1 timeseries slice")
plt.xlabel("GPS time [s]")
plt.ylabel("strain / noise")
plt.grid(True)

plt.tight_layout()
plt.show()
8) Close the file#
Always close HDF5 files when you’re done (especially before overwriting/moving them).
f.close()
print("Closed file.")
Closed file.