
Ibar ANN Model Demo#
Essential Libraries#
import numpy as np
import pandas as pd
import matplotlib.pyplot as plt
from matplotlib import rc
rc('mathtext', fontset='cm')
from typing import Tuple, Dict, List
from IPython.display import display, Latex
from sklearn.metrics import explained_variance_score, max_error, mean_absolute_error,  mean_squared_error, r2_score, mean_absolute_percentage_error


import torch
import torch.nn as nn
import torch.optim as optim
from torch.utils.data import DataLoader, TensorDataset
import torchvision
import torchmetrics, mlxtend

import torchinfo
from torchinfo import summary

import os
import re
import time
Set the device: cuda or cpu#
device = torch.device('cuda:0' if torch.cuda.is_available() else 'cpu')

if torch.cuda.is_available():
    torch.cuda.set_device(device)
Get the data and create some useful features as extensions#
Min and max values of stellar parameters#
C_min = 0.08763469; C_max = 0.30751308;
Mbar_min = 0.909338; Mbar_max = 2.80912;
Rbar_min = 9.93864; Rbar_max = 19.4138;
x_min = 0.1406481; x_max = 0.78176399;
Ibar_min = 4.73725112; Ibar_max = 33.86946319;
D_min = 0.0046990783; D_max = 0.0335965469;
Qbar_min = 1.31339211; Qbar_max = 14.74045551;
logQbar_min = 0.27261318; logQbar_max = 2.69059579;
S3bar_min = 1.73639896; S3bar_max = 32.10634011;
min-max scaling#
min_values = np.array([x_min, Qbar_min])
max_values = np.array([x_max, Qbar_max])

# min-max scaling function
feature_scaler = lambda data: (data - min_values) / (max_values - min_values)
Input layer features: model’s input parameters#
selected_features = ['x','Qbar']
Test subample of NS configurations#
df_test = pd.read_csv("NS_data/test_data_small_sample.csv")
df_test
| M | Req | C | x | Ibar | D | Qbar | log(Qbar) | S3bar | EoS | |
|---|---|---|---|---|---|---|---|---|---|---|
| 0 | 2.190950 | 11.9662 | 0.270131 | 0.166659 | 5.928471 | 0.026846 | 1.935722 | 0.660480 | 3.089488 | SK272 |
| 1 | 1.348410 | 18.3103 | 0.108649 | 0.731341 | 22.361405 | 0.007117 | 7.033574 | 1.950695 | 15.180773 | SKI2 |
| 2 | 2.140930 | 15.1489 | 0.208506 | 0.552628 | 8.784199 | 0.018118 | 2.831782 | 1.040906 | 5.118462 | DD2_2 |
| 3 | 0.990131 | 13.9583 | 0.104655 | 0.387451 | 28.397753 | 0.005605 | 11.565086 | 2.447991 | 24.845141 | DS_CMF-4-Hybr |
| 4 | 1.620250 | 14.0746 | 0.169841 | 0.371895 | 12.573800 | 0.012658 | 4.981185 | 1.605668 | 9.990400 | DS_CMF-8-Hybr |
| ... | ... | ... | ... | ... | ... | ... | ... | ... | ... | ... |
| 397 | 2.200120 | 10.8028 | 0.300475 | 0.297565 | 5.216579 | 0.030509 | 1.544497 | 0.434698 | 2.207297 | BSK26 |
| 398 | 1.972780 | 16.0701 | 0.181116 | 0.655830 | 10.062797 | 0.015816 | 3.133462 | 1.142139 | 6.054977 | Rs |
| 399 | 2.033340 | 13.9065 | 0.215719 | 0.632598 | 7.410619 | 0.021477 | 2.206460 | 0.791389 | 3.821924 | KDE0v1 |
| 400 | 1.142140 | 15.3272 | 0.109939 | 0.565663 | 23.094069 | 0.006892 | 8.345383 | 2.121708 | 17.784955 | PCSB1 |
| 401 | 2.333130 | 14.6437 | 0.235064 | 0.653575 | 6.613759 | 0.024064 | 1.899356 | 0.641515 | 3.077256 | RMF3 |
402 rows × 10 columns
def load_stars(data_frame, batch_size = 2048, shuffle = True):


    df_target = (data_frame['Ibar'])
    np_features = data_frame[selected_features].to_numpy()

    np_targets = df_target.to_numpy()
    np_targets = np.reshape(np_targets, (np_targets.shape[0], 1))

    tensor_features = torch.Tensor(feature_scaler(np_features))

    input_dimension = tensor_features.shape[1]

    tensor_targets = torch.Tensor(np_targets)
    final_dataset = TensorDataset(tensor_features, tensor_targets)

    dataloader = DataLoader(final_dataset, batch_size=batch_size, shuffle=shuffle, num_workers=5, pin_memory=True)

    return dataloader, input_dimension, np_features, np_targets
Dataloader#
batch_size = 2048
test_dataloader, input_dimension, _, _ = load_stars(df_test, batch_size = batch_size)
Feed-forward ANN Model to perform regression#
class RegressorModel(nn.Module):
    def __init__(self,input_dimension, feature_scaler):
        super().__init__()

        self.feature_scaler = feature_scaler

        self.MLP = nn.Sequential(

            nn.Linear(input_dimension, 120),
            nn.GELU(),
            nn.Linear(120, 75),
            nn.GELU(),
            nn.Linear(75, 50),
            nn.GELU(),
            nn.Linear(50, 25),
            nn.GELU(),
            nn.Linear(25, 10),
            nn.GELU(),
            nn.Linear(10, 1),
        )
        # Initialize weights
        for m in self.modules():
            if isinstance(m, nn.Linear):
                nn.init.xavier_uniform_(m.weight)
                nn.init.constant_(m.bias, 0.01)

    def forward(self, x):
        x = self.MLP(x)
        return x

    def predict(self, x):
        x = self.feature_scaler(x).astype('float32')
        x = torch.from_numpy(x).to(self.device)
        x = self.MLP(x)
        x = x.cpu().detach().numpy()
        return x

    def set_device(self, device):
        self.device = device
model_0 = RegressorModel(input_dimension = input_dimension, feature_scaler = feature_scaler)
model_0
RegressorModel(
  (MLP): Sequential(
    (0): Linear(in_features=2, out_features=120, bias=True)
    (1): GELU(approximate='none')
    (2): Linear(in_features=120, out_features=75, bias=True)
    (3): GELU(approximate='none')
    (4): Linear(in_features=75, out_features=50, bias=True)
    (5): GELU(approximate='none')
    (6): Linear(in_features=50, out_features=25, bias=True)
    (7): GELU(approximate='none')
    (8): Linear(in_features=25, out_features=10, bias=True)
    (9): GELU(approximate='none')
    (10): Linear(in_features=10, out_features=1, bias=True)
  )
)
summary(model_0)
=================================================================
Layer (type:depth-idx)                   Param #
=================================================================
RegressorModel                           --
├─Sequential: 1-1                        --
│    └─Linear: 2-1                       360
│    └─GELU: 2-2                         --
│    └─Linear: 2-3                       9,075
│    └─GELU: 2-4                         --
│    └─Linear: 2-5                       3,800
│    └─GELU: 2-6                         --
│    └─Linear: 2-7                       1,275
│    └─GELU: 2-8                         --
│    └─Linear: 2-9                       260
│    └─GELU: 2-10                        --
│    └─Linear: 2-11                      11
=================================================================
Total params: 14,781
Trainable params: 14,781
Non-trainable params: 0
=================================================================
ANN Model evaluation#
Load the trained Model best weights \(\theta^\star\)#
batch_size = 2048
model_path = './Model-Weights/Ibar_inference/model.pth'
dataloader_test, _, np_features_test, np_targets_test = load_stars(df_test, batch_size=batch_size)
regressor = RegressorModel(input_dimension = input_dimension, feature_scaler = feature_scaler).to(device)
regressor.set_device(device)
regressor.load_state_dict(torch.load(model_path, map_location=torch.device(device)))
regressor.eval()
RegressorModel(
  (MLP): Sequential(
    (0): Linear(in_features=2, out_features=120, bias=True)
    (1): GELU(approximate='none')
    (2): Linear(in_features=120, out_features=75, bias=True)
    (3): GELU(approximate='none')
    (4): Linear(in_features=75, out_features=50, bias=True)
    (5): GELU(approximate='none')
    (6): Linear(in_features=50, out_features=25, bias=True)
    (7): GELU(approximate='none')
    (8): Linear(in_features=25, out_features=10, bias=True)
    (9): GELU(approximate='none')
    (10): Linear(in_features=10, out_features=1, bias=True)
  )
)
Residual Error - Fractional difference - Evaluation Measures#
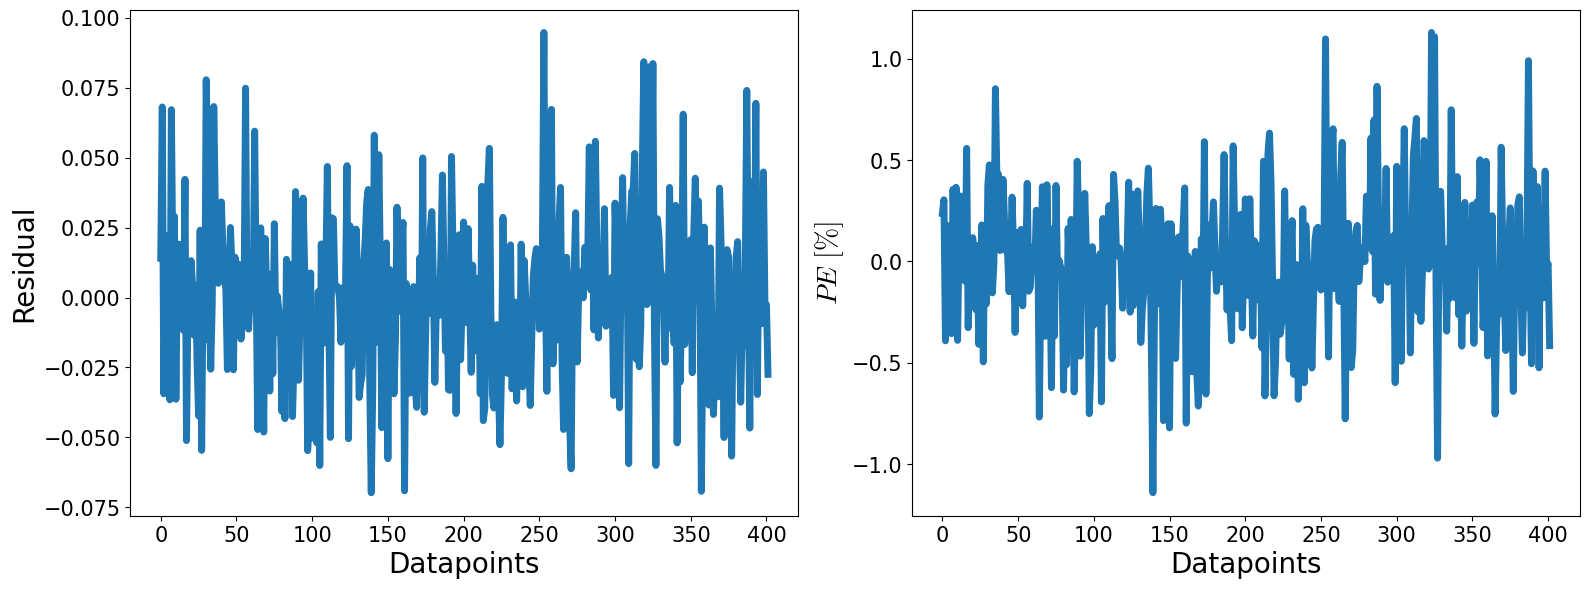
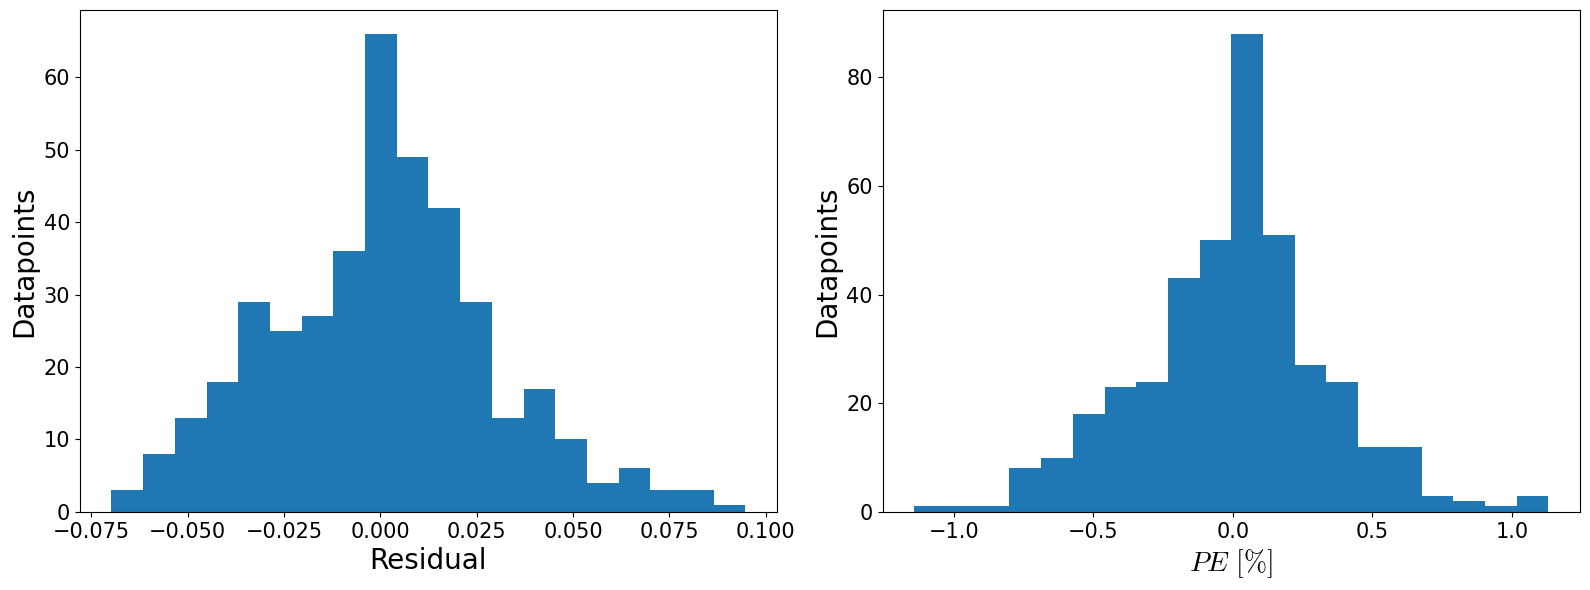
def plot_residuals(residual_error, percentage_error):
    witdh, height = 16, 6
    fontsize = 20
    labelsize = 15
    lw = 5

    fig, ax = plt.subplots(1, 2, figsize=(witdh, height))
    # Residual error subplot
    ax[0].plot(residual_error, lw=lw)
    ax[0].set_xlabel(r'Datapoints', fontsize=fontsize)
    ax[0].set_ylabel(r'Residual', fontsize=fontsize)
    ax[0].tick_params(axis='both', which='both', labelsize=labelsize)

    # Percentage error subplot
    ax[1].plot(percentage_error, lw=lw)
    ax[1].set_xlabel(r'Datapoints', fontsize=fontsize)
    ax[1].set_ylabel(r'$PE \ [\%]$', fontsize=fontsize)
    ax[1].tick_params(axis='both', which='both', labelsize=labelsize)

    plt.tight_layout()
    plt.show()

    fig, ax = plt.subplots(1, 2, figsize=(16, 6))
    fontsize = 20
    labelsize = 15
    lw = 5

    # Residual error histogram
    ax[0].hist(residual_error, bins = 20)
    ax[0].set_ylabel(r'Datapoints', fontsize=fontsize)
    ax[0].set_xlabel(r'Residual', fontsize=fontsize)
    ax[0].tick_params(axis='both', which='both', labelsize=labelsize)

    # Percentage error histogram
    ax[1].hist(percentage_error, bins = 20)
    ax[1].set_ylabel(r'Datapoints', fontsize=fontsize)
    ax[1].set_xlabel(r'$PE \ [\%]$', fontsize=fontsize)
    ax[1].tick_params(axis='both', which='both', labelsize=labelsize)

    plt.tight_layout()
    plt.show()
def Evaluation_Measures(y_true, y_pred):

    exp_var = explained_variance_score(y_true, y_pred)
    max_err = max_error(y_true, y_pred)
    mae = mean_absolute_error(y_true, y_pred)
    mse = mean_squared_error(y_true, y_pred)
    r2 = r2_score(y_true, y_pred)
    mape = mean_absolute_percentage_error(y_true, y_pred)

    measures = {'explained_variance': [exp_var],
                'max_error': [max_err],
                'mean_absolute_error': [mae],
                'mean_squared_error': [mse],
                'r2_score': [r2],
                'mean_absolute_percentage_error': [mape]}

    df_eval_measures = pd.DataFrame(measures)

    return df_eval_measures
Evaluation measures in Test Set subsample#
np_targets_test = np_targets_test.ravel()

model_estimation_test_set = regressor.predict(np_features_test)
model_estimation_test_set = model_estimation_test_set.ravel().astype(np.float64)
test_eval_measures = Evaluation_Measures(y_true = np_targets_test, y_pred = model_estimation_test_set)
test_eval_measures
| explained_variance | max_error | mean_absolute_error | mean_squared_error | r2_score | mean_absolute_percentage_error | |
|---|---|---|---|---|---|---|
| 0 | 0.999968 | 0.094713 | 0.022688 | 0.000863 | 0.999968 | 0.002522 |
Redidual Errors and Pecentange Errors in the test Set subsample#
residual_error_test = model_estimation_test_set - np_targets_test
percentage_error_test = (residual_error_test / np_targets_test) * 100
plot_residuals(residual_error_test, percentage_error_test)
x = 'x'; y = 'Qbar'; w = 'C'; z = 'Ibar' ; z_model = 'Ibar_model';
def mesh_grid_funct(number_of_points, data_frame, x_name, y_name):

    number_of_points = number_of_points
    x = np.linspace(data_frame[x_name].min(), data_frame[x_name].max(),number_of_points)
    y = np.linspace(data_frame[y_name].min(), data_frame[y_name].max(),number_of_points)
    X,Y = np.meshgrid(x, y)

    return X,Y
def Ibar_model(x,y):
    x_flat = x.flatten()
    y_flat = y.flatten()
    input_features = np.column_stack((x_flat, y_flat))
    ANN_estimation = regressor.predict(input_features)
    ANN_estimation = ANN_estimation.ravel().astype(np.float64)
    return ANN_estimation.reshape(x.shape)
x_d = mesh_grid_funct(500,df_test,x_name = 'x', y_name = 'Qbar')[0]
y_d = mesh_grid_funct(500,df_test, x_name = 'x', y_name = 'Qbar')[1]
Z = Ibar_model(x_d,y_d)
Z
array([[ 4.71680498,  4.71790171,  4.71897745, ...,  5.07278204,
         5.07712984,  5.08148241],
       [ 4.76480246,  4.76587248,  4.76692104, ...,  5.15787935,
         5.16248751,  5.16709948],
       [ 4.81217432,  4.81322002,  4.81424427, ...,  5.24307585,
         5.24795103,  5.25282431],
       ...,
       [25.25303459, 25.26319695, 25.27339935, ..., 36.89966965,
        36.93255615, 36.96546173],
       [25.30081558, 25.31100655, 25.32122993, ..., 36.96367264,
        36.99657822, 37.02952194],
       [25.348629  , 25.35883904, 25.3690834 , ..., 37.02765274,
        37.0606041 , 37.09358978]])
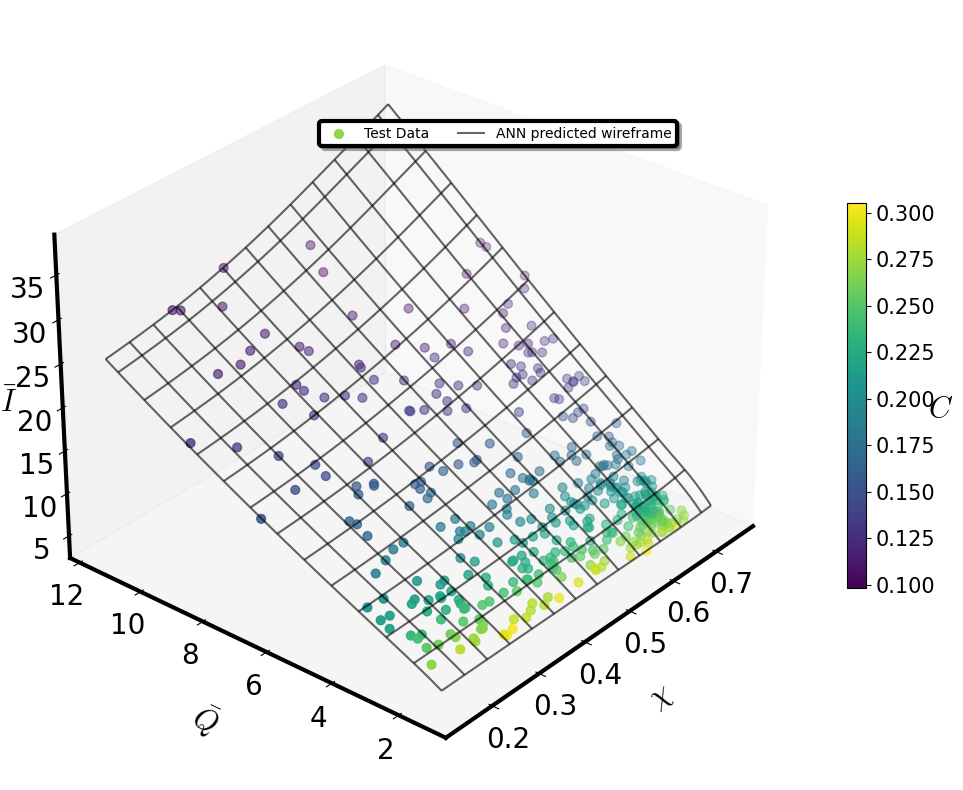
def Surface_plot(df,x,y,w,z, xlabel,ylabel,wlabel, zlabel, view2, n_col, border_axes, X,Y, Z, l_w):

    fig = plt.figure(figsize=(12 ,8))
    labels_text_size = 20
    ax = fig.add_subplot(111, projection='3d')

    dot_size = 40; font_size = 22; label_pad = 20; label_size = 20

    #######################################################################################################
    scatter = ax.scatter(df[x].to_numpy(),df[y].to_numpy(),df[z].to_numpy(),
                c = df[w].to_numpy(), s = dot_size, cmap = 'viridis', marker='o', label = 'Test Data')


    cbar = plt.colorbar(scatter,  shrink=0.5)
    cbar.set_label(wlabel, fontsize=font_size, rotation=0)
    cbar.ax.tick_params(labelsize=15)

    ax.plot_wireframe(X, Y, Z, rstride=40, cstride=40,edgecolor='blue' ,color = 'black',
                      alpha=0.6, lw = l_w, antialiased=True, label = r'ANN predicted wireframe')
    #######################################################################################################


    ax.view_init(30, view2)
    ax.set_xlabel(xlabel, fontsize=font_size,labelpad=label_pad)
    ax.set_ylabel(ylabel, fontsize=font_size,labelpad=label_pad)

    ax.zaxis.set_rotate_label(False)
    ax.set_zlabel(zlabel, fontsize=font_size,labelpad=label_pad, rotation = 0)
    ax.yaxis._axinfo['label']['space_factor'] = 3.0

    ax.zaxis.labelpad = 1

    ax.xaxis.set_tick_params(labelsize=label_size)
    ax.yaxis.set_tick_params(labelsize=label_size)
    ax.zaxis.set_tick_params(labelsize=label_size)

    for axis in [ax.xaxis, ax.yaxis, ax.zaxis]:
        axis.line.set_linewidth(3)

    ax.grid(False)


    leg = plt.legend(loc="best",ncol=n_col, borderaxespad=border_axes, prop={'size': 10}, shadow=True, fontsize="large",bbox_to_anchor=(1,1))    #,bbox_to_anchor=(1,1)
    leg.get_frame().set_linewidth(3.0)
    leg.get_frame().set_edgecolor('black')

    plt.tight_layout()
    plt.show()
Surface_plot(df_test, x,y,w, z, xlabel=r'$\chi$',ylabel=r'$\bar{Q}$',wlabel = r'$C$',
                    zlabel=r'$\bar{I}$',
                     view2=220, n_col=3, border_axes=8, X=x_d,Y=y_d,Z=Z, l_w=1.5)
df_test['Ibar_model'] = model_estimation_test_set
df_test['Ibar_model']
0       5.942539
1      22.429504
2       8.749806
3      28.402727
4      12.595914
         ...
397     5.207217
398    10.107667
399     7.407748
400    23.091530
401     6.586307
Name: Ibar_model, Length: 402, dtype: float64
def Ibar_ANN_model(x,y):
    input_features = np.column_stack((x, y))
    ANN_estimation = regressor.predict(input_features)
    ANN_estimation = ANN_estimation.ravel().astype(np.float64)
    return ANN_estimation.reshape(x.shape)
Ibar_ANN_model(df_test['x'], df_test['Qbar'])
array([ 5.94253874, 22.42950439,  8.7498064 , 28.40272713, 12.59591389,
        8.56383228, 10.22689342, 18.94309807, 19.50136757,  7.96560669,
        9.298522  , 10.47081089,  5.92380524, 12.30579281, 16.33580017,
       12.03332233,  7.6106801 , 15.60511494, 17.62935257,  8.09980011,
       11.22237015, 11.57355595,  5.67462587,  5.31435823,  5.76583242,
       15.09576797, 13.37362766, 10.96837902,  5.81161928,  7.28054714,
       20.66594505,  9.53198433, 21.69073105, 16.51927567, 18.03246307,
        8.0736866 ,  8.43906879,  7.23509121,  9.40719128, 20.25867081,
        8.47350121,  9.07724285, 15.43716049,  5.91390371, 17.23755074,
        7.23955011,  7.91113234, 19.88973618,  7.34835958, 10.231493  ,
       16.87092972,  8.77140141,  7.42349672,  6.77229929, 18.30089569,
        5.45793915, 19.47567177,  5.27750206,  8.81849003, 16.32118034,
        6.92009211,  6.91075516, 23.5961628 ,  6.45788813,  6.0999403 ,
       21.14434052,  6.7757926 ,  7.77799749, 12.96806622,  5.5927701 ,
       13.88210773, 25.79408264,  5.3322506 ,  5.19359303,  7.38388872,
        7.06194258, 16.27389336,  8.57856369, 19.18071365, 11.36365891,
        6.37029505,  9.89191914,  8.45672512,  8.39969635, 11.30278683,
        5.76058531, 15.52482414,  6.56257677, 11.73357964,  7.69304991,
       10.40142822,  6.29599142,  6.28211451, 28.57122231, 10.60849476,
       15.08159828,  9.73247433,  7.23442888,  8.38228798, 12.01124001,
       15.93824768,  9.32122803, 16.76057816, 22.58818054,  5.4740243 ,
        8.60514736,  9.04972076,  8.1913023 , 18.9767952 ,  5.678617  ,
       17.03251266,  8.86751842, 10.36756516,  6.6601243 ,  9.65781689,
       13.16840172,  7.7053628 ,  5.62776995,  6.23641825,  6.91932344,
       15.43883419,  8.15712738,  6.19231272, 12.09578323, 20.12613297,
        7.70368385, 11.21217251, 10.98328781, 18.25008774,  7.04213333,
        6.94399691,  8.89390659, 12.77393341, 18.54925919, 19.53923607,
        6.26328707,  7.41885948, 22.64038277,  6.74086046,  6.04286051,
       11.15058231, 22.24883652, 18.69735909,  5.35817766, 19.86832237,
       14.00503635,  5.87345123,  9.93649387,  6.63662195, 10.48118019,
        6.95074511,  5.44647169, 14.20776081, 17.19236374,  7.15489054,
       10.45202732, 26.68057632,  6.60874271, 26.17228699, 11.22219849,
        7.41943741,  8.58854198, 18.65996933,  7.06430244,  9.5024786 ,
        6.20666265, 17.10374069,  7.92251778,  5.6520381 ,  5.46168184,
        9.16575623, 12.74444008, 14.02109241,  8.48912716,  6.22455168,
       13.48121929,  9.36179733, 17.35868454, 17.38588905, 10.4777422 ,
       12.84236145, 20.58132935,  6.74109888, 22.15555954,  6.31308222,
       11.06289101,  8.33942223, 23.91719627,  7.97468615,  5.59012461,
       13.89281654,  8.4622612 ,  8.8835783 , 10.33417416,  6.02835369,
       17.6999855 ,  6.21034622,  9.66492558,  6.77174568,  9.16226768,
        8.76990318,  5.85000849,  5.31159067,  7.97360373,  6.55223894,
        7.2363162 , 11.32906818, 10.06041622, 26.13080406,  8.61939526,
        6.17639685,  8.03656769,  8.07546234,  6.58431625, 13.7685833 ,
        6.97446108,  6.51139021, 13.62143517,  7.1706152 ,  5.19221449,
        7.91946411, 12.13836861,  9.53827286,  9.15776825, 17.15616989,
       10.15056133,  8.26349449, 13.47346592,  9.03901672,  5.60541105,
       15.56672382,  9.35068798,  5.82479525,  7.88994503, 10.10643959,
        5.39898872,  7.2356863 ,  7.17068052,  7.35360098,  5.29547453,
        7.42834044,  5.95989275,  6.99849939, 11.09934711,  7.29875946,
        6.93671465,  7.095963  ,  8.59821606, 10.36683941, 14.66749477,
        8.02297401,  9.32565975, 20.23165321,  8.72145462, 15.86874676,
        7.07558203,  6.77113152,  9.07063389, 10.33710194, 17.64885902,
       18.18505096, 10.92130852,  7.69044638,  6.46599436,  6.72986364,
       19.31536293,  6.02407694,  8.11807442,  7.65903521,  5.8109436 ,
        8.50008297, 14.08646965,  4.87231684,  6.86225986, 17.07066917,
       23.19758797, 18.68510818, 14.95412731, 13.43946648, 17.06033707,
        5.59177208, 10.35808945, 23.23772049,  8.89413166,  5.48963499,
        6.61693621,  7.15705156,  6.51440287,  8.46193027,  7.50184107,
        8.6398201 ,  9.45433903,  5.52976179,  6.94809008, 10.01861286,
        6.83149195, 19.73762321, 11.63566017,  5.68741751,  5.81490564,
        7.220819  ,  7.32569027,  9.50969601,  7.95607805,  5.68404436,
        6.58159208, 14.30222607, 10.79623699, 10.19293213, 13.09441566,
       24.34504509,  7.34973288,  6.35933924,  7.34648371,  8.84320164,
        5.41070271,  8.34196949, 20.47180367,  7.71977854, 14.99274158,
       11.07747364,  6.86522198, 17.95749855,  7.385571  ,  7.88119888,
        7.61990833,  7.60348749,  6.12265968,  9.59123135,  6.35701847,
       12.6051178 , 15.40842724,  6.84742403,  6.69683743,  8.16146564,
        6.06969118,  5.29520559, 11.54886627,  6.29559851,  9.03127861,
        7.89647102, 19.63361168,  6.50367498,  7.19318724, 20.42921066,
       22.55209351,  6.83603573, 11.38172245,  8.06968307, 10.31652069,
        7.46994495,  6.6204896 , 12.07319641, 14.52846622, 16.58254051,
        6.91767454,  7.1219058 , 21.15527534,  5.71515942,  5.11594105,
        6.48343897, 26.58725357,  8.63310337,  7.86090517,  8.7987566 ,
        5.50716496,  6.92485237,  7.32693911, 13.78075504,  6.97029495,
       26.76197433,  8.71059132, 11.3271265 ,  5.50043726, 18.77139282,
        5.46655416, 10.54493332,  8.78380108,  6.73627853, 13.57623959,
        5.23013353,  6.28325844,  9.18770981,  8.2522707 ,  6.08530807,
        7.54180288, 15.68400097,  7.54359293,  5.48882818,  9.19505119,
        9.31094646, 11.15265369,  8.67226601, 18.87565231,  6.57331324,
       11.58958435, 13.56396198,  5.20721674, 10.10766697,  7.40774822,
       23.09152985,  6.58630705])
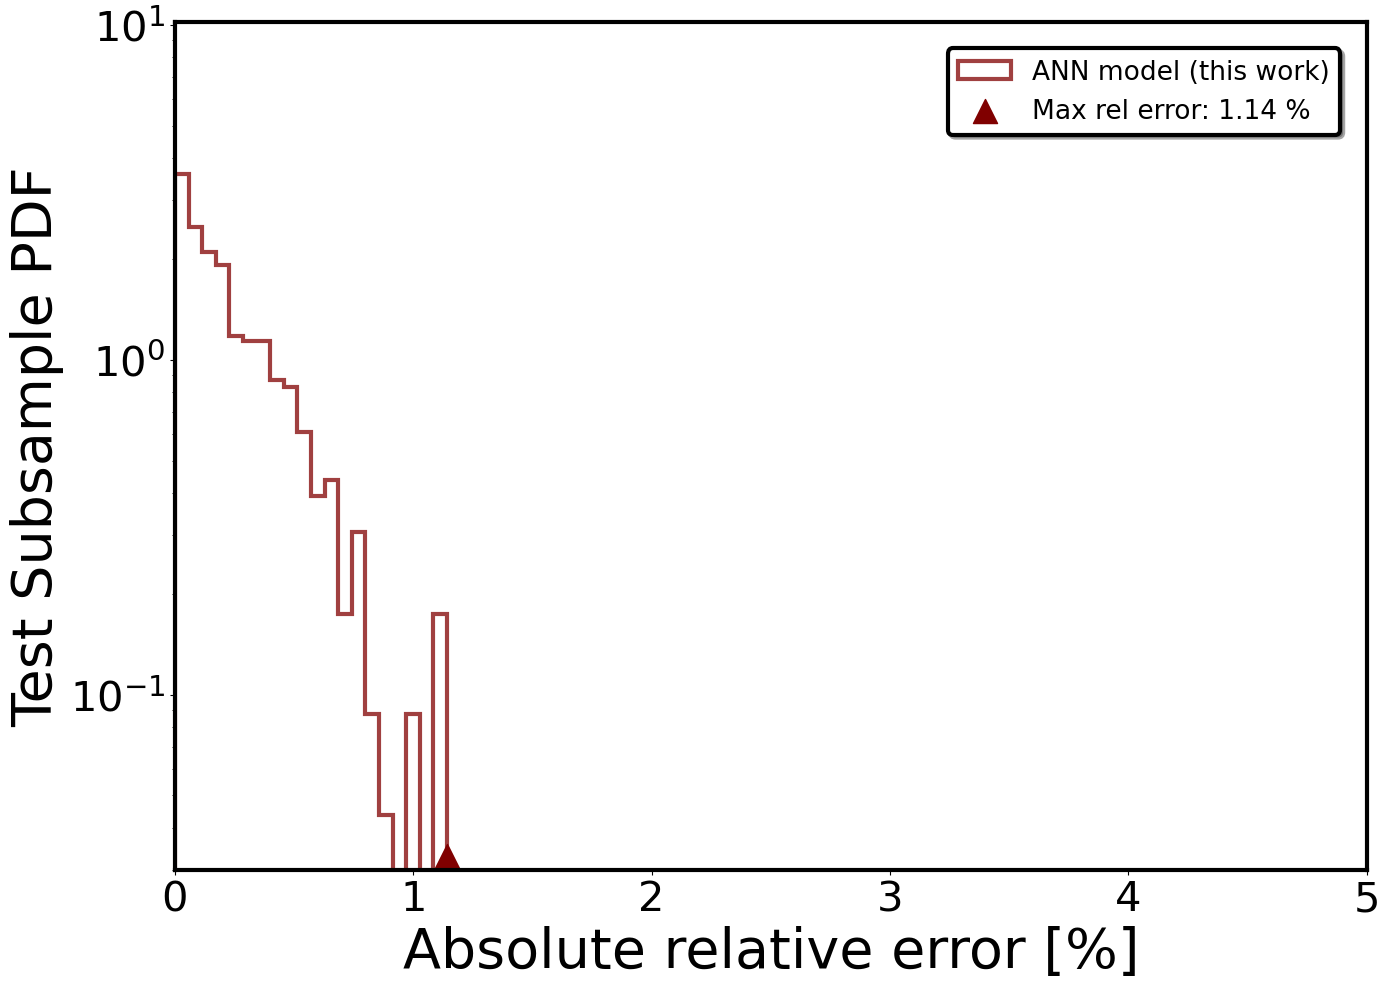
Model’s fractional differences associated with the test set’s subsample#
fig,ax = plt.subplots(figsize=(14, 10),)
labels_text_size = 40
plt.xticks(fontsize=30)
plt.yticks(fontsize=30)

xlabel = r'Absolute relative error [%]'
ylabel = r'Test Subsample PDF'


plt.xlabel(xlabel,size=labels_text_size)
plt.ylabel(ylabel,size=labels_text_size)

bins = 20
alpha = 0.75

density = True

y_reg_model = (np.abs(100*(-df_test['Ibar'] + df_test['Ibar_model'])/df_test['Ibar'])).hist(
    density=density,
    bins=bins,
    lw=3,
    edgecolor='maroon',
    zorder=1,
    histtype='step',
    alpha=alpha,
    label=f"ANN model (this work)",
    color='maroon',
    #log = True
).autoscale(enable=True, axis='both', tight=True)

max_deviation = (np.abs(100*(-df_test['Ibar'] + df_test['Ibar_model'])/df_test['Ibar'])).max()

vertical_lines = [max_deviation]
plt.scatter(vertical_lines[0], 3.3e-2, color='maroon',  marker='^', s=300, zorder=2, label=f'Max rel error: {np.round(max_deviation, 2)} %')  # Star marker


for axis in ['top','bottom','left','right']:
    ax.spines[axis].set_linewidth(3.)


plt.yscale('log')


plt.xlim(0,5)

plt.ylim(3e-2,10.2)

plt.grid(False)
leg = plt.legend(loc="upper right",ncol=1, borderaxespad=1, prop={'size': 19}, shadow=True, fontsize="large")    #,bbox_to_anchor=(1,1)
leg.get_frame().set_linewidth(3.0)
leg.get_frame().set_edgecolor('black')

plt.tight_layout()
plt.show()