
Evaluate triggers#
AresGW ACME training session#
Nikolaos Stergioulas
Aristotle University of Thessaloniki
# 1. Import Required Libraries
import h5py
import numpy as np
import pandas as pd
import matplotlib.pyplot as plt
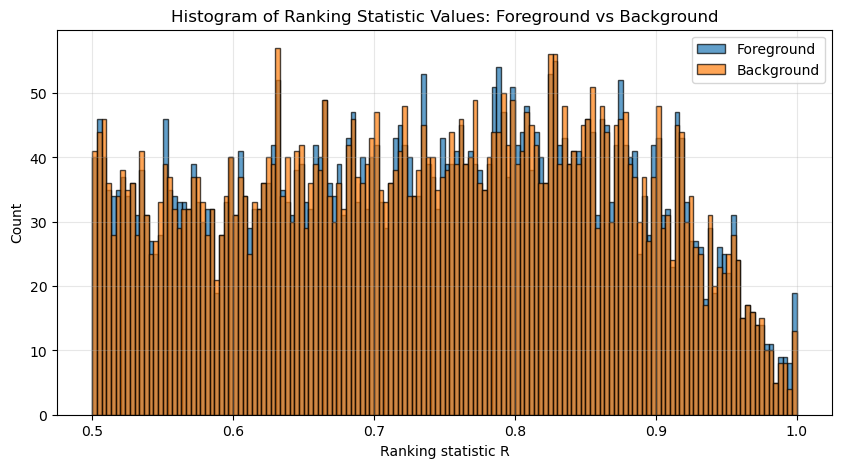
# 2. Load foreground and background event files and plot ranking statistic histograms
import h5py
import matplotlib.pyplot as plt
import numpy as np

fg_path = "results/test_fgevents.hdf"
bg_path = "results/test_bgevents.hdf"

with h5py.File(fg_path, "r") as fg, h5py.File(bg_path, "r") as bg:
    fg_stat = fg["stat"][:]
    bg_stat = bg["stat"][:]
    print(f"Loaded {len(fg_stat)} foreground and {len(bg_stat)} background events.")

plt.figure(figsize=(10, 5))
plt.hist(fg_stat, bins=150, alpha=0.7, label="Foreground", color="tab:blue", edgecolor="black")
plt.hist(bg_stat, bins=150, alpha=0.7, label="Background", color="tab:orange", edgecolor="black")
plt.xlabel("Ranking statistic R")
plt.ylabel("Count")
plt.title("Histogram of Ranking Statistic Values: Foreground vs Background")
plt.legend()
plt.grid(True, alpha=0.3)
plt.show()
Loaded 5256 foreground and 5250 background events.
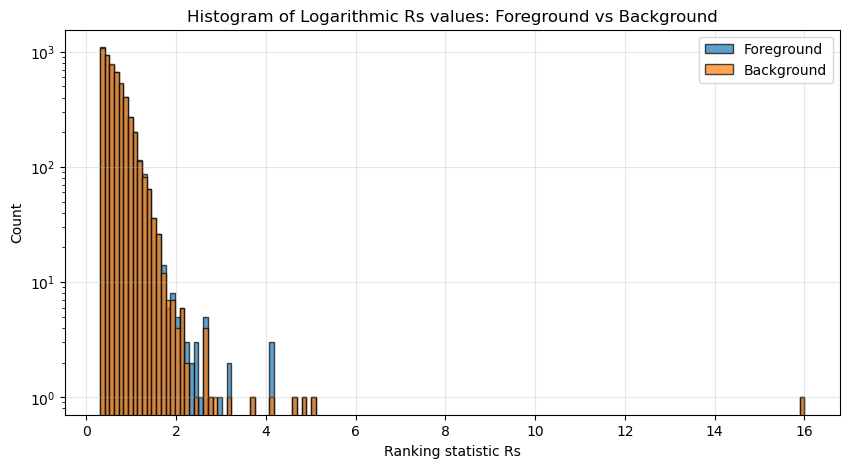
# Convert R to the logarithmi Rs = -log10(1 - R + 1e-16)

fg_Rs = -np.log10(1 - fg_stat + 1e-16)
bg_Rs = -np.log10(1 - bg_stat + 1e-16)

plt.figure(figsize=(10, 5))
plt.hist(fg_Rs, bins=150, alpha=0.7, label="Foreground", color="tab:blue", edgecolor="black")
plt.hist(bg_Rs, bins=150, alpha=0.7, label="Background", color="tab:orange", edgecolor="black")
plt.xlabel("Ranking statistic Rs")
plt.ylabel("Count")
plt.yscale("log")
plt.title("Histogram of Logarithmic Rs values: Foreground vs Background")
plt.legend()
plt.grid(True, alpha=0.3)
plt.show()
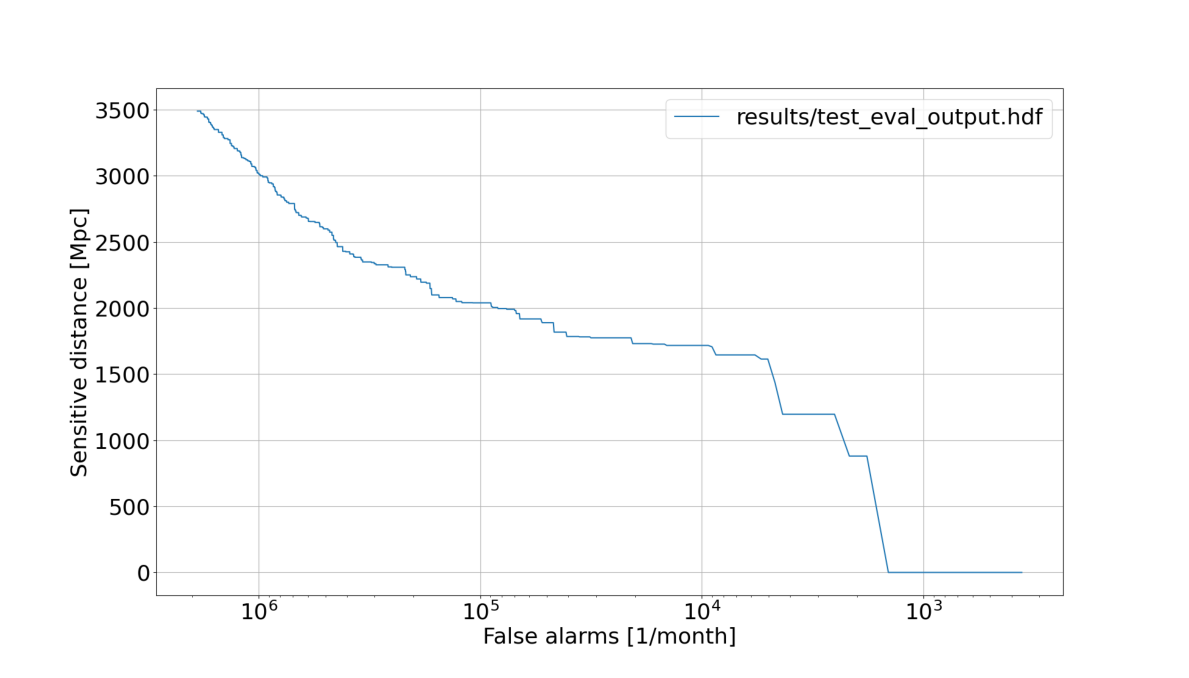
import os
from PIL import Image

# Run the sensitivity plot script
cmd = [
    "python3", "sensitivity_plot.py",
    "--files", "results/test_eval_output.hdf",
    "--output", "results/test_eval_output_plot.png",
    "--no-tex", "--force"
]

result = os.system(" ".join(cmd))
print(f"Command exit code: {result}")

# Load and display the resulting figure
if os.path.exists("results/test_eval_output_plot.png"):
    img = Image.open("results/test_eval_output_plot.png")
    plt.figure(figsize=(12, 8))
    plt.imshow(img)
    plt.axis("off")
    plt.tight_layout()
    plt.show()
else:
    print("Output image not found.")
Command exit code: 0