
Mxf ANN Model Demo#
Essential Libraries#
import numpy as np
import pandas as pd
import matplotlib.pyplot as plt
from matplotlib import rc
rc('mathtext', fontset='cm')
from typing import Tuple, Dict, List
from IPython.display import display, Latex
from sklearn.metrics import explained_variance_score, max_error, mean_absolute_error,  mean_squared_error, r2_score, mean_absolute_percentage_error


import torch
import torch.nn as nn
import torch.optim as optim
from torch.utils.data import DataLoader, TensorDataset
import torchvision
import torchmetrics, mlxtend

import torchinfo
from torchinfo import summary

import os
import re
import time
Set the device: cuda or cpu#
device = torch.device('cuda:0' if torch.cuda.is_available() else 'cpu')

if torch.cuda.is_available():
    torch.cuda.set_device(device)
Get the data and create some useful features as extensions#
Min and max values of stellar parameters#
C_min = 0.095273; C_max = 0.306475;
x_min = 0.140648; x_max = 0.202447;
Mxf_min = 0.00079856; Mxf_max = 0.00610166;
min-max scaling#
min_values = np.array([x_min, C_min])
max_values = np.array([x_max, C_max])

# min-max scaling function
feature_scaler = lambda data: (data - min_values) / (max_values - min_values)
Input layer features: model’s input parameters#
selected_features = ['x','C']
Test subample of NS configurations#
df_test = pd.read_csv("NS_data/test_data_relatively_slow_rot_conf_small_sample.csv")
df_test
| C | x | Qbar | Mxfhat | EoS | |
|---|---|---|---|---|---|
| 0 | 0.274288 | 0.148618 | 1.850285 | 0.004124 | SkOp |
| 1 | 0.188028 | 0.146573 | 4.554646 | 0.002160 | QHC21-CT |
| 2 | 0.138709 | 0.151386 | 8.147240 | 0.001355 | DS(CMF)-3 |
| 3 | 0.129106 | 0.168744 | 8.847651 | 0.001385 | RMF4 |
| 4 | 0.253535 | 0.147812 | 2.306878 | 0.003548 | BSK22 |
| ... | ... | ... | ... | ... | ... |
| 423 | 0.181573 | 0.179808 | 4.849369 | 0.002516 | DNS |
| 424 | 0.266069 | 0.150634 | 2.100849 | 0.003830 | BSK24 |
| 425 | 0.231998 | 0.178583 | 2.800615 | 0.003760 | DS(CMF)-6 |
| 426 | 0.170897 | 0.164532 | 5.489028 | 0.002089 | DS(CMF)-7 |
| 427 | 0.249371 | 0.147699 | 2.422240 | 0.003438 | GM1Y6 |
428 rows × 5 columns
def load_stars(data_frame, batch_size = 2048, shuffle = True):


    df_target = (data_frame['Mxfhat'])
    np_features = data_frame[selected_features].to_numpy()

    np_targets = df_target.to_numpy()
    np_targets = np.reshape(np_targets, (np_targets.shape[0], 1))

    tensor_features = torch.Tensor(feature_scaler(np_features))

    input_dimension = tensor_features.shape[1]

    tensor_targets = torch.Tensor(np_targets)
    final_dataset = TensorDataset(tensor_features, tensor_targets)

    dataloader = DataLoader(final_dataset, batch_size=batch_size, shuffle=shuffle, num_workers=5, pin_memory=True)

    return dataloader, input_dimension, np_features, np_targets
Dataloader#
batch_size = 16
test_dataloader, input_dimension, _, _ = load_stars(df_test, batch_size = batch_size)
Feed-forward ANN Model to perform regression#
class ModifiedSigmoid(nn.Module):
    def forward(self, x):
        return Mxf_min + (Mxf_max - Mxf_min)*torch.sigmoid(x)
class RegressorModel(nn.Module):
    def __init__(self,input_dimension, feature_scaler):
        super().__init__()

        self.feature_scaler = feature_scaler

        self.MLP = nn.Sequential(

            nn.Linear(input_dimension, 120),
            nn.GELU(),
            nn.Linear(120, 75),
            nn.GELU(),
            nn.Linear(75, 50),
            nn.GELU(),
            nn.Linear(50, 25),
            nn.GELU(),
            nn.Linear(25, 10),
            nn.GELU(),
            nn.Linear(10, 1),
            ModifiedSigmoid(), # a modification of sigmoid activation function

        )
        # Initialize weights
        for m in self.modules():
            if isinstance(m, nn.Linear):
                nn.init.xavier_uniform_(m.weight)
                nn.init.constant_(m.bias, 0.01)

    def forward(self, x):
        x = self.MLP(x)
        return x

    def predict(self, x):
        x = self.feature_scaler(x).astype('float32')
        x = torch.from_numpy(x).to(self.device)
        x = self.MLP(x)
        x = x.cpu().detach().numpy()
        return x

    def set_device(self, device):
        self.device = device
model_0 = RegressorModel(input_dimension = input_dimension, feature_scaler = feature_scaler)
model_0
RegressorModel(
  (MLP): Sequential(
    (0): Linear(in_features=2, out_features=120, bias=True)
    (1): GELU(approximate='none')
    (2): Linear(in_features=120, out_features=75, bias=True)
    (3): GELU(approximate='none')
    (4): Linear(in_features=75, out_features=50, bias=True)
    (5): GELU(approximate='none')
    (6): Linear(in_features=50, out_features=25, bias=True)
    (7): GELU(approximate='none')
    (8): Linear(in_features=25, out_features=10, bias=True)
    (9): GELU(approximate='none')
    (10): Linear(in_features=10, out_features=1, bias=True)
    (11): ModifiedSigmoid()
  )
)
summary(model_0)
=================================================================
Layer (type:depth-idx)                   Param #
=================================================================
RegressorModel                           --
├─Sequential: 1-1                        --
│    └─Linear: 2-1                       360
│    └─GELU: 2-2                         --
│    └─Linear: 2-3                       9,075
│    └─GELU: 2-4                         --
│    └─Linear: 2-5                       3,800
│    └─GELU: 2-6                         --
│    └─Linear: 2-7                       1,275
│    └─GELU: 2-8                         --
│    └─Linear: 2-9                       260
│    └─GELU: 2-10                        --
│    └─Linear: 2-11                      11
│    └─ModifiedSigmoid: 2-12             --
=================================================================
Total params: 14,781
Trainable params: 14,781
Non-trainable params: 0
=================================================================
ANN Model evaluation#
Load the trained Model best weights \(\theta^\star\)#
batch_size = 16
model_path = './Model-Weights/Mxf_inference/model.pth'
dataloader_test, _, np_features_test, np_targets_test = load_stars(df_test, batch_size=batch_size)
regressor = RegressorModel(input_dimension = input_dimension, feature_scaler = feature_scaler).to(device)
regressor.set_device(device)
regressor.load_state_dict(torch.load(model_path, map_location=torch.device(device)))
regressor.eval()
RegressorModel(
  (MLP): Sequential(
    (0): Linear(in_features=2, out_features=120, bias=True)
    (1): GELU(approximate='none')
    (2): Linear(in_features=120, out_features=75, bias=True)
    (3): GELU(approximate='none')
    (4): Linear(in_features=75, out_features=50, bias=True)
    (5): GELU(approximate='none')
    (6): Linear(in_features=50, out_features=25, bias=True)
    (7): GELU(approximate='none')
    (8): Linear(in_features=25, out_features=10, bias=True)
    (9): GELU(approximate='none')
    (10): Linear(in_features=10, out_features=1, bias=True)
    (11): ModifiedSigmoid()
  )
)
Residual Error - Fractional difference - Evaluation Measures#
def plot_residuals(residual_error, percentage_error):
    witdh, height = 16, 6
    fontsize = 20
    labelsize = 15
    lw = 5

    fig, ax = plt.subplots(1, 2, figsize=(witdh, height))
    # Residual error subplot
    ax[0].plot(residual_error, lw=lw)
    ax[0].set_xlabel(r'Datapoints', fontsize=fontsize)
    ax[0].set_ylabel(r'Residual', fontsize=fontsize)
    ax[0].tick_params(axis='both', which='both', labelsize=labelsize)

    # Percentage error subplot
    ax[1].plot(percentage_error, lw=lw)
    ax[1].set_xlabel(r'Datapoints', fontsize=fontsize)
    ax[1].set_ylabel(r'$PE \ [\%]$', fontsize=fontsize)
    ax[1].tick_params(axis='both', which='both', labelsize=labelsize)

    plt.tight_layout()
    plt.show()

    fig, ax = plt.subplots(1, 2, figsize=(16, 6))
    fontsize = 20
    labelsize = 15
    lw = 5

    # Residual error histogram
    ax[0].hist(residual_error, bins = 20)
    ax[0].set_ylabel(r'Datapoints', fontsize=fontsize)
    ax[0].set_xlabel(r'Residual', fontsize=fontsize)
    ax[0].tick_params(axis='both', which='both', labelsize=labelsize)

    # Percentage error histogram
    ax[1].hist(percentage_error, bins = 20)
    ax[1].set_ylabel(r'Datapoints', fontsize=fontsize)
    ax[1].set_xlabel(r'$PE \ [\%]$', fontsize=fontsize)
    ax[1].tick_params(axis='both', which='both', labelsize=labelsize)

    plt.tight_layout()
    plt.show()
def Evaluation_Measures(y_true, y_pred):

    exp_var = explained_variance_score(y_true, y_pred)
    max_err = max_error(y_true, y_pred)
    mae = mean_absolute_error(y_true, y_pred)
    mse = mean_squared_error(y_true, y_pred)
    r2 = r2_score(y_true, y_pred)
    mape = mean_absolute_percentage_error(y_true, y_pred)

    measures = {'explained_variance': [exp_var],
                'max_error': [max_err],
                'mean_absolute_error': [mae],
                'mean_squared_error': [mse],
                'r2_score': [r2],
                'mean_absolute_percentage_error': [mape]}

    df_eval_measures = pd.DataFrame(measures)

    return df_eval_measures
Evaluation measures in Test Set subsample#
np_targets_test = np_targets_test.ravel()

model_estimation_test_set = regressor.predict(np_features_test)
model_estimation_test_set = model_estimation_test_set.ravel().astype(np.float64)
test_eval_measures = Evaluation_Measures(y_true = np_targets_test, y_pred = model_estimation_test_set)
test_eval_measures
| explained_variance | max_error | mean_absolute_error | mean_squared_error | r2_score | mean_absolute_percentage_error | |
|---|---|---|---|---|---|---|
| 0 | 0.999992 | 0.000014 | 0.000002 | 9.703797e-12 | 0.999992 | 0.000942 |
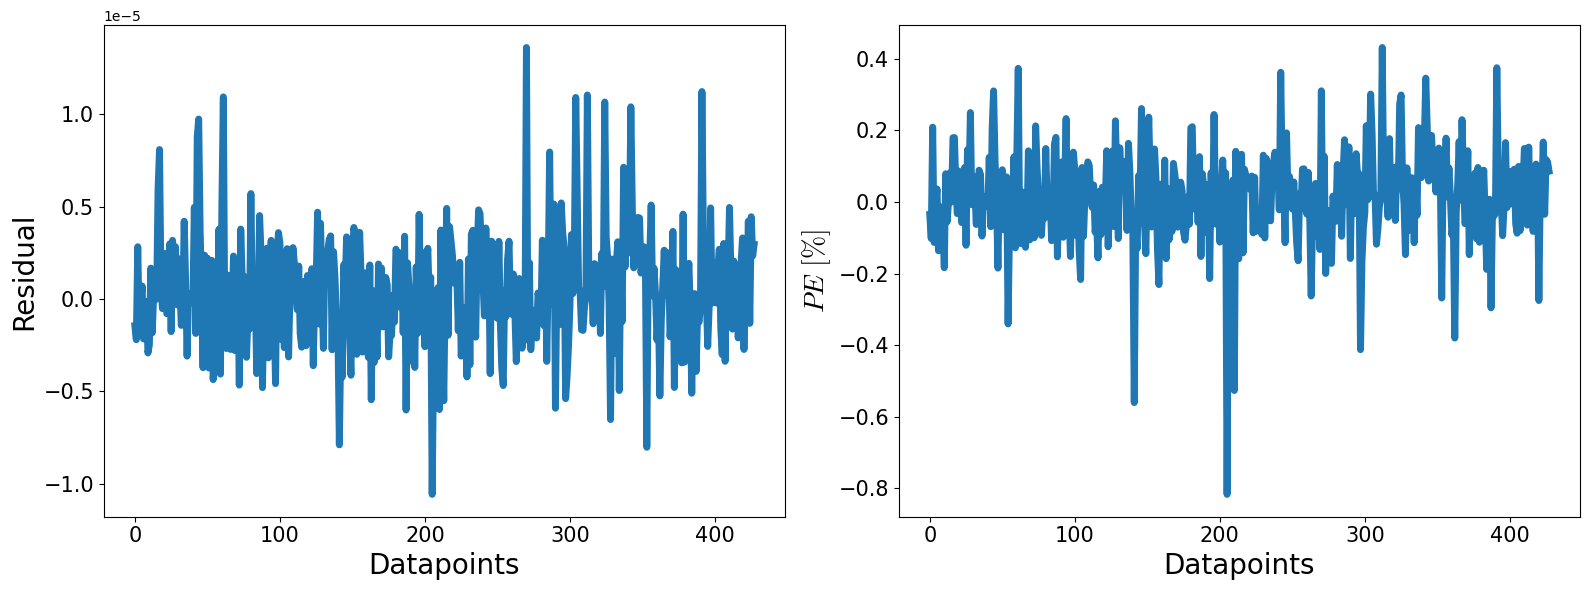
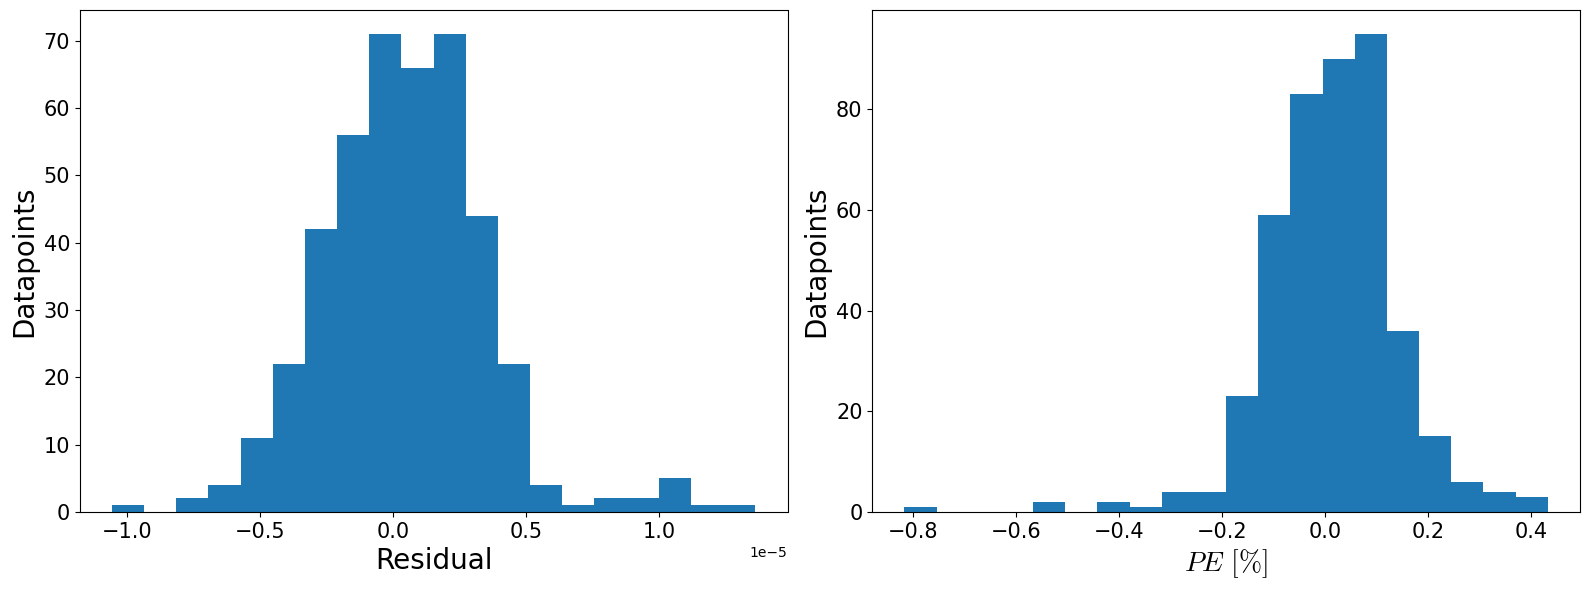
Redidual Errors and Pecentange Errors in the test Set subsample#
residual_error_test = model_estimation_test_set - np_targets_test
percentage_error_test = (residual_error_test / np_targets_test) * 100
plot_residuals(residual_error_test, percentage_error_test)
df_test['Mxfhat_model'] = model_estimation_test_set
def mesh_grid_funct(number_of_points, data_frame,x_name, y_name):

    number_of_points = number_of_points

    x = np.linspace(data_frame[x_name].min(), data_frame[x_name].max(),number_of_points)
    y = np.linspace(data_frame[y_name].min(), data_frame[y_name].max(),number_of_points)

    X,Y = np.meshgrid(x, y)

    return X,Y
x_d = mesh_grid_funct(1000,df_test,x_name = 'x', y_name = 'C')[0]
y_d = mesh_grid_funct(1000,df_test, x_name = 'x', y_name = 'C')[1]
def Mxfhat_model(x,y):
    x_flat = x.flatten()
    y_flat = y.flatten()
    input_features = np.column_stack((x_flat, y_flat))
    ANN_estimation = regressor.predict(input_features)
    ANN_estimation = ANN_estimation.ravel().astype(np.float64)
    return ANN_estimation.reshape(x.shape)
Z = Mxfhat_model(x_d,y_d)
Z
array([[0.00093772, 0.0009375 , 0.00093729, ..., 0.001067  , 0.00106678,
        0.00106656],
       [0.0009399 , 0.00093969, 0.00093947, ..., 0.00106969, 0.00106947,
        0.00106925],
       [0.0009421 , 0.00094188, 0.00094166, ..., 0.00107238, 0.00107216,
        0.00107194],
       ...,
       [0.00472863, 0.00472875, 0.00472889, ..., 0.00563735, 0.0056352 ,
        0.00563304],
       [0.00473332, 0.00473344, 0.00473357, ..., 0.00564778, 0.00564564,
        0.0056435 ],
       [0.004738  , 0.00473812, 0.00473825, ..., 0.0056582 , 0.00565608,
        0.00565394]])
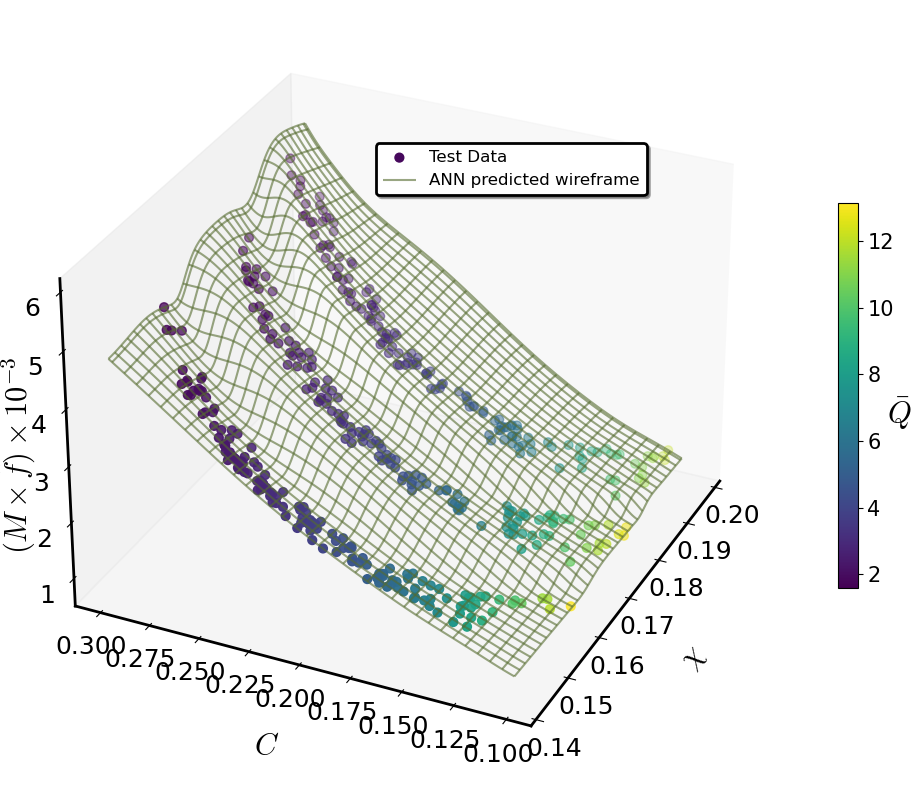
x = 'x'; y = 'C'; w = 'Qbar'; z = 'Mxfhat';
def Surface_plot(df,x,y,w,z, xlabel,ylabel,wlabel, zlabel, view2, n_col, border_axes, X,Y, Z, l_w):

    fig = plt.figure(figsize=(12 ,8))
    labels_text_size = 20
    ax = fig.add_subplot(111, projection='3d')

    dot_size = 40
    font_size = 22
    label_pad = 20
    label_size = 18


    #######################################################################################################

    scatter = ax.scatter(df[x].to_numpy(),df[y].to_numpy(),1000*df[z].to_numpy(),
                    c = df[w].to_numpy(), s = dot_size, cmap = 'viridis', marker='o', label = 'Test Data')


    cbar = plt.colorbar(scatter,  shrink=0.5)
    cbar.set_label(wlabel, fontsize=font_size, rotation=0)
    cbar.ax.tick_params(labelsize=15)

    ax.plot_wireframe(X, Y, 1000*Z, rstride=30, cstride=30,edgecolor='blue' ,color = 'darkolivegreen',
                      alpha=0.6, lw = l_w, antialiased=True, label = r'ANN predicted wireframe')

    #######################################################################################################


    ax.view_init(30, view2)
    ax.set_xlabel(xlabel, fontsize=font_size,labelpad=label_pad, rotation = 90)
    ax.yaxis.set_rotate_label(False)
    ax.set_ylabel(ylabel, fontsize=font_size,labelpad=label_pad, rotation = 0)

    ax.zaxis.set_rotate_label(False)
    ax.set_zlabel(zlabel, fontsize=font_size,labelpad=label_pad, rotation = 90)

    ax.yaxis._axinfo['label']['space_factor'] = 3.0

    ax.zaxis.labelpad = 0
    ax.zaxis._axinfo['label']['space_factor'] = 0


    ax.xaxis.set_tick_params(labelsize=label_size)
    ax.yaxis.set_tick_params(labelsize=label_size)
    ax.zaxis.set_tick_params(labelsize=label_size)


    for axis in [ax.xaxis, ax.yaxis, ax.zaxis]:
        axis.line.set_linewidth(2)

    ax.grid(False)


    leg = plt.legend(loc="best",ncol=n_col, borderaxespad=border_axes, prop={'size': 12}, shadow=True, fontsize="large")    #,bbox_to_anchor=(1,1)
    leg.get_frame().set_linewidth(2.0)
    leg.get_frame().set_edgecolor('black')

    plt.tight_layout()
    plt.show()
Surface_plot(df_test, x,y,w, z, xlabel=r'$\chi$',ylabel=r'$ C $',wlabel = r'$\bar{Q}$',
                    zlabel=r'$(M\times \hat{f})\times 10^{-3}$',
                     view2=205, n_col=1, border_axes=8, X=x_d,Y=y_d,Z=Z, l_w=1.5)
def Mxf_ANN_model(x,y):
    input_features = np.column_stack((x, y))
    ANN_estimation = regressor.predict(input_features)
    ANN_estimation = ANN_estimation.ravel().astype(np.float64)
    return ANN_estimation.reshape(x.shape)
Mxf_ANN_model(df_test['x'], df_test['C'])
array([0.0041225 , 0.00215783, 0.00135775, 0.00138304, 0.00354791,
       0.00195427, 0.00158214, 0.00490336, 0.00087542, 0.00491169,
       0.00134864, 0.00212468, 0.00330811, 0.00491756, 0.00136025,
       0.004233  , 0.00332886, 0.00450729, 0.00187877, 0.00158296,
       0.00287799, 0.00171747, 0.0013806 , 0.00150001, 0.00311272,
       0.00145609, 0.00218005, 0.00490883, 0.00113589, 0.00408165,
       0.00302649, 0.00136221, 0.0022662 , 0.00158041, 0.0047547 ,
       0.00125108, 0.00323698, 0.00335905, 0.00182533, 0.00208961,
       0.00163871, 0.00398472, 0.00269337, 0.0043514 , 0.00315098,
       0.00318001, 0.00422622, 0.0020064 , 0.00396053, 0.00231608,
       0.00246202, 0.00479365, 0.00129399, 0.00299579, 0.00127576,
       0.00335126, 0.00345072, 0.00210926, 0.00301469, 0.00316599,
       0.00431065, 0.00294282, 0.00161134, 0.0022893 , 0.00465472,
       0.00353552, 0.00214942, 0.00202597, 0.00163394, 0.00263615,
       0.00242572, 0.00205857, 0.00464847, 0.00178554, 0.00116067,
       0.0038987 , 0.00472985, 0.00337772, 0.00456904, 0.00354173,
       0.00382804, 0.00156591, 0.00120454, 0.00453522, 0.00373108,
       0.00153562, 0.00278629, 0.00137199, 0.00312313, 0.00157912,
       0.00424931, 0.00246324, 0.00322767, 0.00242906, 0.0013679 ,
       0.00402987, 0.00382509, 0.00300176, 0.00467401, 0.00258649,
       0.00339834, 0.00233566, 0.00166163, 0.00194015, 0.0010078 ,
       0.00283567, 0.00324731, 0.00338177, 0.00171509, 0.00249124,
       0.0019087 , 0.00223655, 0.00375191, 0.00378104, 0.00220754,
       0.00472784, 0.00099237, 0.00323665, 0.00275402, 0.0031084 ,
       0.00218082, 0.00338061, 0.00114935, 0.00287706, 0.00289039,
       0.00382738, 0.00330721, 0.00196285, 0.0018138 , 0.00121561,
       0.00261265, 0.00164032, 0.00281743, 0.00299224, 0.00284226,
       0.00479163, 0.00344718, 0.00156774, 0.00139099, 0.00205017,
       0.00193713, 0.00140041, 0.00308606, 0.00322988, 0.00253006,
       0.00409321, 0.00129253, 0.00261075, 0.00331415, 0.0028502 ,
       0.0024351 , 0.00163909, 0.00460187, 0.00426337, 0.00394255,
       0.00244   , 0.001884  , 0.00216488, 0.00097957, 0.00288179,
       0.00462482, 0.00232022, 0.00157974, 0.00343418, 0.00123682,
       0.0032302 , 0.00104139, 0.00379781, 0.00176176, 0.00117149,
       0.00402099, 0.00214083, 0.00134803, 0.0021124 , 0.00243428,
       0.00369112, 0.00167101, 0.00325407, 0.00137548, 0.00199621,
       0.00130825, 0.00118179, 0.0015377 , 0.00206494, 0.00350523,
       0.00316651, 0.00269087, 0.00393931, 0.00247962, 0.00214448,
       0.00503374, 0.00395776, 0.00118361, 0.00172578, 0.00213886,
       0.00300244, 0.00188164, 0.00280311, 0.00261707, 0.00451369,
       0.00229719, 0.00523569, 0.00234767, 0.00309277, 0.00145352,
       0.00128375, 0.00323919, 0.00300269, 0.00196323, 0.00101319,
       0.00112959, 0.00264481, 0.00230351, 0.00346055, 0.00115045,
       0.00368976, 0.00137988, 0.00430351, 0.00431417, 0.00412768,
       0.00142538, 0.00252149, 0.0017192 , 0.0019892 , 0.00288518,
       0.0037638 , 0.00380156, 0.00268251, 0.00144211, 0.00463947,
       0.00166388, 0.00353885, 0.00288885, 0.00349958, 0.00174377,
       0.00391437, 0.00378598, 0.00445902, 0.003326  , 0.00224277,
       0.00107648, 0.00411624, 0.00106599, 0.00158377, 0.00450915,
       0.00354192, 0.00162559, 0.00363542, 0.00315865, 0.00418947,
       0.00526541, 0.00557956, 0.00530325, 0.00322798, 0.0028448 ,
       0.00195949, 0.00501555, 0.00235109, 0.00338359, 0.00430257,
       0.00243315, 0.00164304, 0.00146219, 0.00128625, 0.00150128,
       0.00393324, 0.00164157, 0.00275809, 0.00243463, 0.00121954,
       0.00439863, 0.00211489, 0.00154523, 0.00137013, 0.00370114,
       0.00140842, 0.0025105 , 0.00122674, 0.00203843, 0.0018417 ,
       0.00201645, 0.0030452 , 0.00463769, 0.00362971, 0.00351629,
       0.00155131, 0.00458708, 0.00348029, 0.0046061 , 0.00334354,
       0.00373461, 0.001552  , 0.00260186, 0.00423699, 0.0038677 ,
       0.00497433, 0.00355087, 0.00130122, 0.00254274, 0.00354921,
       0.0011917 , 0.00164094, 0.00489406, 0.00257706, 0.00363111,
       0.00292845, 0.00396451, 0.00220275, 0.00141019, 0.00224717,
       0.00345271, 0.00200749, 0.00257108, 0.00440591, 0.00365898,
       0.00223505, 0.00313808, 0.00108542, 0.00147617, 0.00155027,
       0.00191074, 0.00359747, 0.00253665, 0.00185832, 0.00390641,
       0.00112787, 0.00377099, 0.00440298, 0.00442931, 0.00227281,
       0.00370029, 0.0022265 , 0.00292746, 0.0046545 , 0.00434539,
       0.00318071, 0.00328848, 0.00344101, 0.00124777, 0.004773  ,
       0.00324355, 0.00214394, 0.00301803, 0.00235644, 0.00289766,
       0.00381381, 0.00231911, 0.00485283, 0.00455949, 0.00508757,
       0.00202336, 0.00188373, 0.00259266, 0.00298089, 0.00225604,
       0.00384572, 0.00285977, 0.00123423, 0.00176135, 0.00256673,
       0.00239776, 0.00095607, 0.00137367, 0.00360001, 0.00152959,
       0.00156928, 0.00407975, 0.00109582, 0.00337454, 0.00337867,
       0.00225123, 0.00256526, 0.00324584, 0.00321273, 0.00210629,
       0.00285734, 0.00121782, 0.00335733, 0.00477511, 0.00302904,
       0.00285921, 0.00146735, 0.00218445, 0.00120616, 0.00270022,
       0.00382946, 0.00398157, 0.00132004, 0.00338668, 0.0031419 ,
       0.00116334, 0.00300672, 0.00393014, 0.00544124, 0.00161278,
       0.00272337, 0.00298338, 0.00298067, 0.00132104, 0.00262796,
       0.00174184, 0.00411914, 0.00330697, 0.0029485 , 0.00257715,
       0.00344437, 0.00302966, 0.00418352, 0.00419089, 0.00262436,
       0.00331941, 0.00129711, 0.00251263, 0.00134689, 0.00229039,
       0.00404962, 0.00255249, 0.00401012, 0.00181071, 0.00350112,
       0.00098846, 0.00341595, 0.0019475 , 0.0025207 , 0.00382901,
       0.00376466, 0.00209149, 0.00344067])
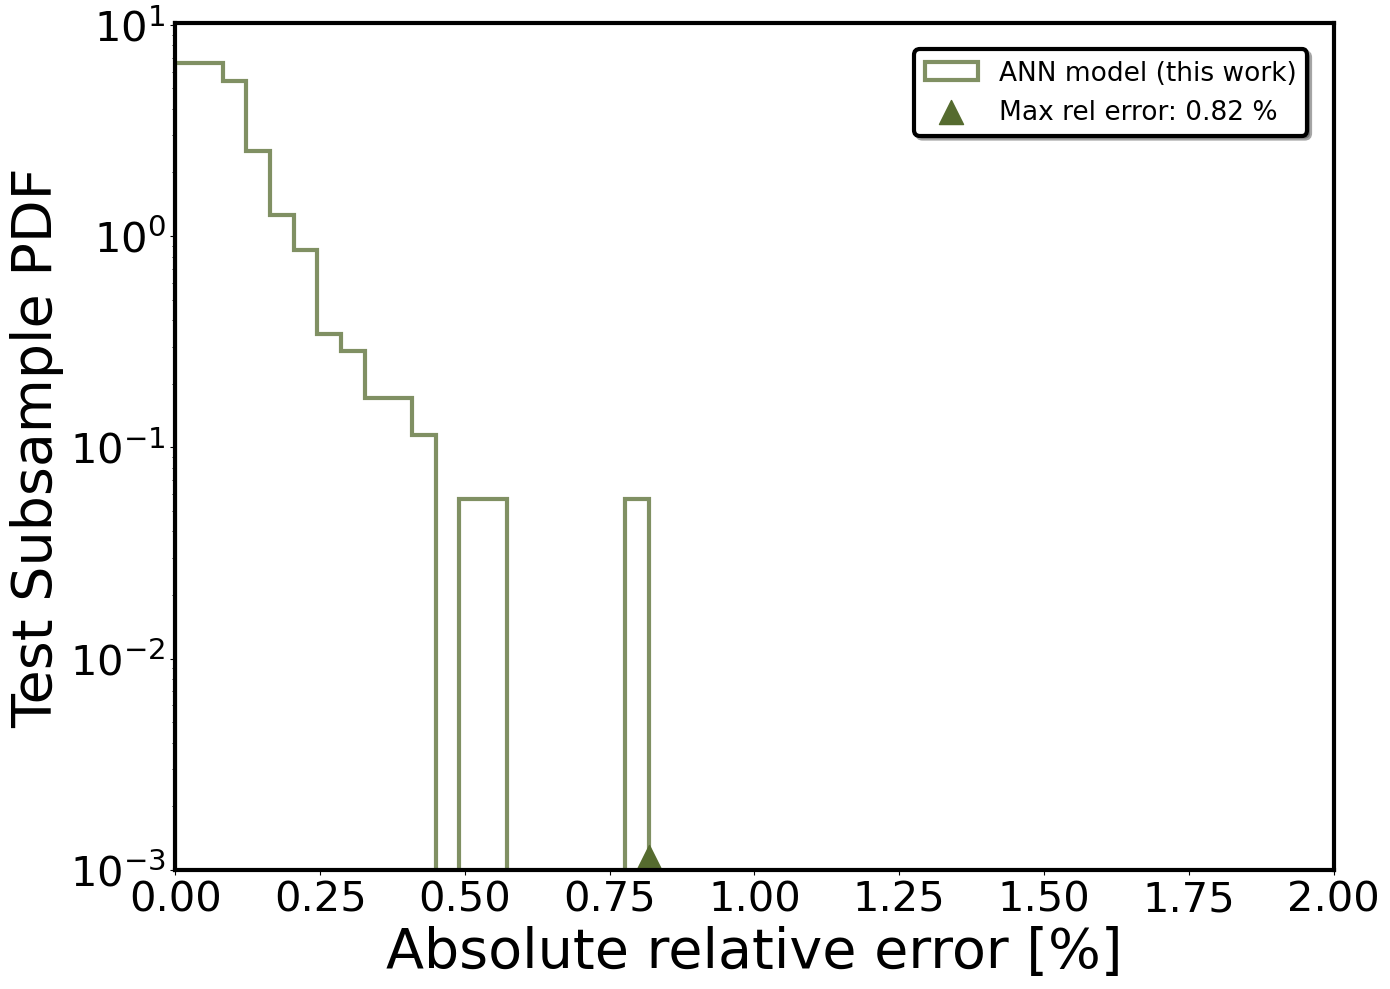
Model’s fractional differences associated with the test set’s subsample#
fig,ax = plt.subplots(figsize=(14, 10),)
labels_text_size = 40
plt.xticks(fontsize=30)
plt.yticks(fontsize=30)

xlabel = r'Absolute relative error [%]'
ylabel = r'Test Subsample PDF'


plt.xlabel(xlabel,size=labels_text_size)
plt.ylabel(ylabel,size=labels_text_size)

bins = 20
alpha = 0.75

density = True

y_reg_model = (np.abs(100*(-df_test['Mxfhat'] + df_test['Mxfhat_model'])/df_test['Mxfhat'])).hist(
    density=density,
    bins=bins,
    lw=3,
    edgecolor='darkolivegreen',
    zorder=1,
    histtype='step',
    alpha=alpha,
    label=f"ANN model (this work)",
    color='darkolivegreen'
).autoscale(enable=True, axis='both', tight=True)

max_deviation = (np.abs(100*(-df_test['Mxfhat'] + df_test['Mxfhat_model'])/df_test['Mxfhat'])).max()

vertical_lines = [max_deviation]

plt.scatter(vertical_lines[0], 1.15e-3, color='darkolivegreen',  marker='^', s=300, zorder=2, label=f'Max rel error: {np.round(max_deviation, 2)} %')  # Star marker

for axis in ['top','bottom','left','right']:
    ax.spines[axis].set_linewidth(3.)


plt.yscale('log')

plt.xlim(0,2.)


plt.ylim(1e-3,10.2)

plt.grid(False)
leg = plt.legend(loc="upper right",ncol=1, borderaxespad=1, prop={'size': 19}, shadow=True, fontsize="large")
leg.get_frame().set_linewidth(3.0)
leg.get_frame().set_edgecolor('black')


plt.tight_layout()
plt.show()