

Inspect injections HDF and npy files#
AresGW ACME training session#
Nikolaos Stergioulas
Aristotle University of Thessaloniki
1) SETUP#
import h5py
import numpy as np
import pandas as pd
import matplotlib.pyplot as plt

HDF_PATH = "data7200/injections_train.hdf"

# Convenience: limit prints / loads
MAX_CHILDREN_TO_PRINT = 50
DEFAULT_SLICE = slice(0, 4096)  # first 4096 samples for quick inspection
2) INSPECT ROOT-LEVEL CONTENTS#
f = h5py.File(HDF_PATH, "r")
print("Opened:", f.filename)
print("Root keys:", list(f.keys()))
print("Root attributes:")
for k, v in f.attrs.items():
    print(f"  - {k}: {v}")
Opened: data7200/injections_train.hdf
Root keys: ['chirp_distance', 'coa_phase', 'dec', 'distance', 'inclination', 'mass1', 'mass2', 'mchirp', 'polarization', 'q', 'ra', 'spin1_a', 'spin1_azimuthal', 'spin1_polar', 'spin1x', 'spin1y', 'spin1z', 'spin2_a', 'spin2_azimuthal', 'spin2_polar', 'spin2x', 'spin2y', 'spin2z', 'tc']
Root attributes:
  - approximant: IMRPhenomXPHM
  - cmd: /home/niksterg/miniconda3/envs/generatedata/bin/pycbc_create_injections --config-files /home/niksterg/Repositories/local/ACME-AresGW-dev/generatedata/ds4.ini --gps-start-time 1238205077 --gps-end-time 1253966055 --time-step 24 --time-window 6 --seed 42 --output-file injections_train.hdf --verbose --force
  - f_lower: 20.0
  - f_ref: 20.0
  - injtype: cbc
  - mode_array: 22 21 33 32 44
  - static_args: ['f_ref' 'f_lower' 'approximant' 'taper' 'mode_array']
  - taper: start
3) PRINT THE TREE (GROUPS/DATASETS) WITH SHAPES AND DATA TYPES#
def _short(x, maxlen=120):
    s = str(x)
    return s if len(s) <= maxlen else s[:maxlen] + "…"

def print_hdf5_tree(obj, prefix="", max_depth=6, depth=0, max_children=MAX_CHILDREN_TO_PRINT):
    """Recursively print an HDF5 tree with basic info."""
    if depth > max_depth:
        print(prefix + "… (max depth reached)")
        return

    if isinstance(obj, h5py.File) or isinstance(obj, h5py.Group):
        keys = list(obj.keys())
        if len(keys) > max_children:
            keys = keys[:max_children]
            truncated = True
        else:
            truncated = False

        for name in keys:
            item = obj[name]
            if isinstance(item, h5py.Group):
                print(f"{prefix}{name}/  (Group)  attrs={len(item.attrs)}")
                print_hdf5_tree(item, prefix + "  ", max_depth, depth + 1, max_children)
            elif isinstance(item, h5py.Dataset):
                shape = item.shape
                dtype = item.dtype
                print(f"{prefix}{name}  (Dataset) shape={shape}, dtype={dtype}, attrs={len(item.attrs)}")
            else:
                print(f"{prefix}{name}  ({type(item)})")

        if truncated:
            print(prefix + f"… ({len(obj.keys()) - max_children} more children not shown)")
    else:
        print(prefix + f"(Unknown object type: {type(obj)})")

print_hdf5_tree(f)
chirp_distance  (Dataset) shape=(583719,), dtype=float64, attrs=0
coa_phase  (Dataset) shape=(583719,), dtype=float64, attrs=0
dec  (Dataset) shape=(583719,), dtype=float64, attrs=0
distance  (Dataset) shape=(583719,), dtype=float64, attrs=0
inclination  (Dataset) shape=(583719,), dtype=float64, attrs=0
mass1  (Dataset) shape=(583719,), dtype=float64, attrs=0
mass2  (Dataset) shape=(583719,), dtype=float64, attrs=0
mchirp  (Dataset) shape=(583719,), dtype=float64, attrs=0
polarization  (Dataset) shape=(583719,), dtype=float64, attrs=0
q  (Dataset) shape=(583719,), dtype=float64, attrs=0
ra  (Dataset) shape=(583719,), dtype=float64, attrs=0
spin1_a  (Dataset) shape=(583719,), dtype=float64, attrs=0
spin1_azimuthal  (Dataset) shape=(583719,), dtype=float64, attrs=0
spin1_polar  (Dataset) shape=(583719,), dtype=float64, attrs=0
spin1x  (Dataset) shape=(583719,), dtype=float64, attrs=0
spin1y  (Dataset) shape=(583719,), dtype=float64, attrs=0
spin1z  (Dataset) shape=(583719,), dtype=float64, attrs=0
spin2_a  (Dataset) shape=(583719,), dtype=float64, attrs=0
spin2_azimuthal  (Dataset) shape=(583719,), dtype=float64, attrs=0
spin2_polar  (Dataset) shape=(583719,), dtype=float64, attrs=0
spin2x  (Dataset) shape=(583719,), dtype=float64, attrs=0
spin2y  (Dataset) shape=(583719,), dtype=float64, attrs=0
spin2z  (Dataset) shape=(583719,), dtype=float64, attrs=0
tc  (Dataset) shape=(583719,), dtype=float64, attrs=0
4) HISTOGRAMS OF ALL WAVEFORM PARAMETERS#
try:
    # Load injection parameters from separate datasets at root level
    inj_df = pd.DataFrame()
    with h5py.File(HDF_PATH, 'r') as fh:
        # Get all datasets at root level
        for key in sorted(fh.keys()):
            item = fh[key]
            if isinstance(item, h5py.Dataset):
                inj_df[key] = item[()]

    if inj_df.empty:
        raise ValueError("No datasets found at root level")

except Exception as e:
    print(f"Error loading injections: {e}")
    inj_df = pd.DataFrame()

if inj_df.empty:
    print("Could not load injection table.")
else:
    print(f"Loaded {len(inj_df)} injections with {len(inj_df.columns)} variables")
    print(f"Columns: {list(inj_df.columns)}")

    # Create histograms for all numeric columns
    numeric_cols = inj_df.select_dtypes(include=[np.number]).columns.tolist()

    if numeric_cols:
        # Create a grid of subplots
        n_cols = 4
        n_rows = (len(numeric_cols) + n_cols - 1) // n_cols

        fig, axes = plt.subplots(n_rows, n_cols, figsize=(16, 4*n_rows))
        axes = axes.flatten()  # Flatten to 1D for easier indexing

        for idx, col in enumerate(numeric_cols):
            ax = axes[idx]
            data = inj_df[col].dropna()

            # Use appropriate number of bins
            n_bins = min(50, max(10, len(data)//100))
            ax.hist(data, bins=n_bins, edgecolor='black', alpha=0.7)
            ax.set_xlabel(col, fontsize=9)
            ax.set_ylabel('Count', fontsize=9)
            ax.set_title(f'{col}\n(n={len(data)}, μ={data.mean():.3e}, σ={data.std():.3e})', fontsize=9)
            ax.grid(True, alpha=0.3)

        # Hide unused subplots
        for idx in range(len(numeric_cols), len(axes)):
            axes[idx].set_visible(False)

        plt.tight_layout()
        plt.show()

        # Print summary statistics
        print("\n--- Summary Statistics ---")
        print(inj_df[numeric_cols].describe())
Loaded 583719 injections with 24 variables
Columns: ['chirp_distance', 'coa_phase', 'dec', 'distance', 'inclination', 'mass1', 'mass2', 'mchirp', 'polarization', 'q', 'ra', 'spin1_a', 'spin1_azimuthal', 'spin1_polar', 'spin1x', 'spin1y', 'spin1z', 'spin2_a', 'spin2_azimuthal', 'spin2_polar', 'spin2x', 'spin2y', 'spin2z', 'tc']
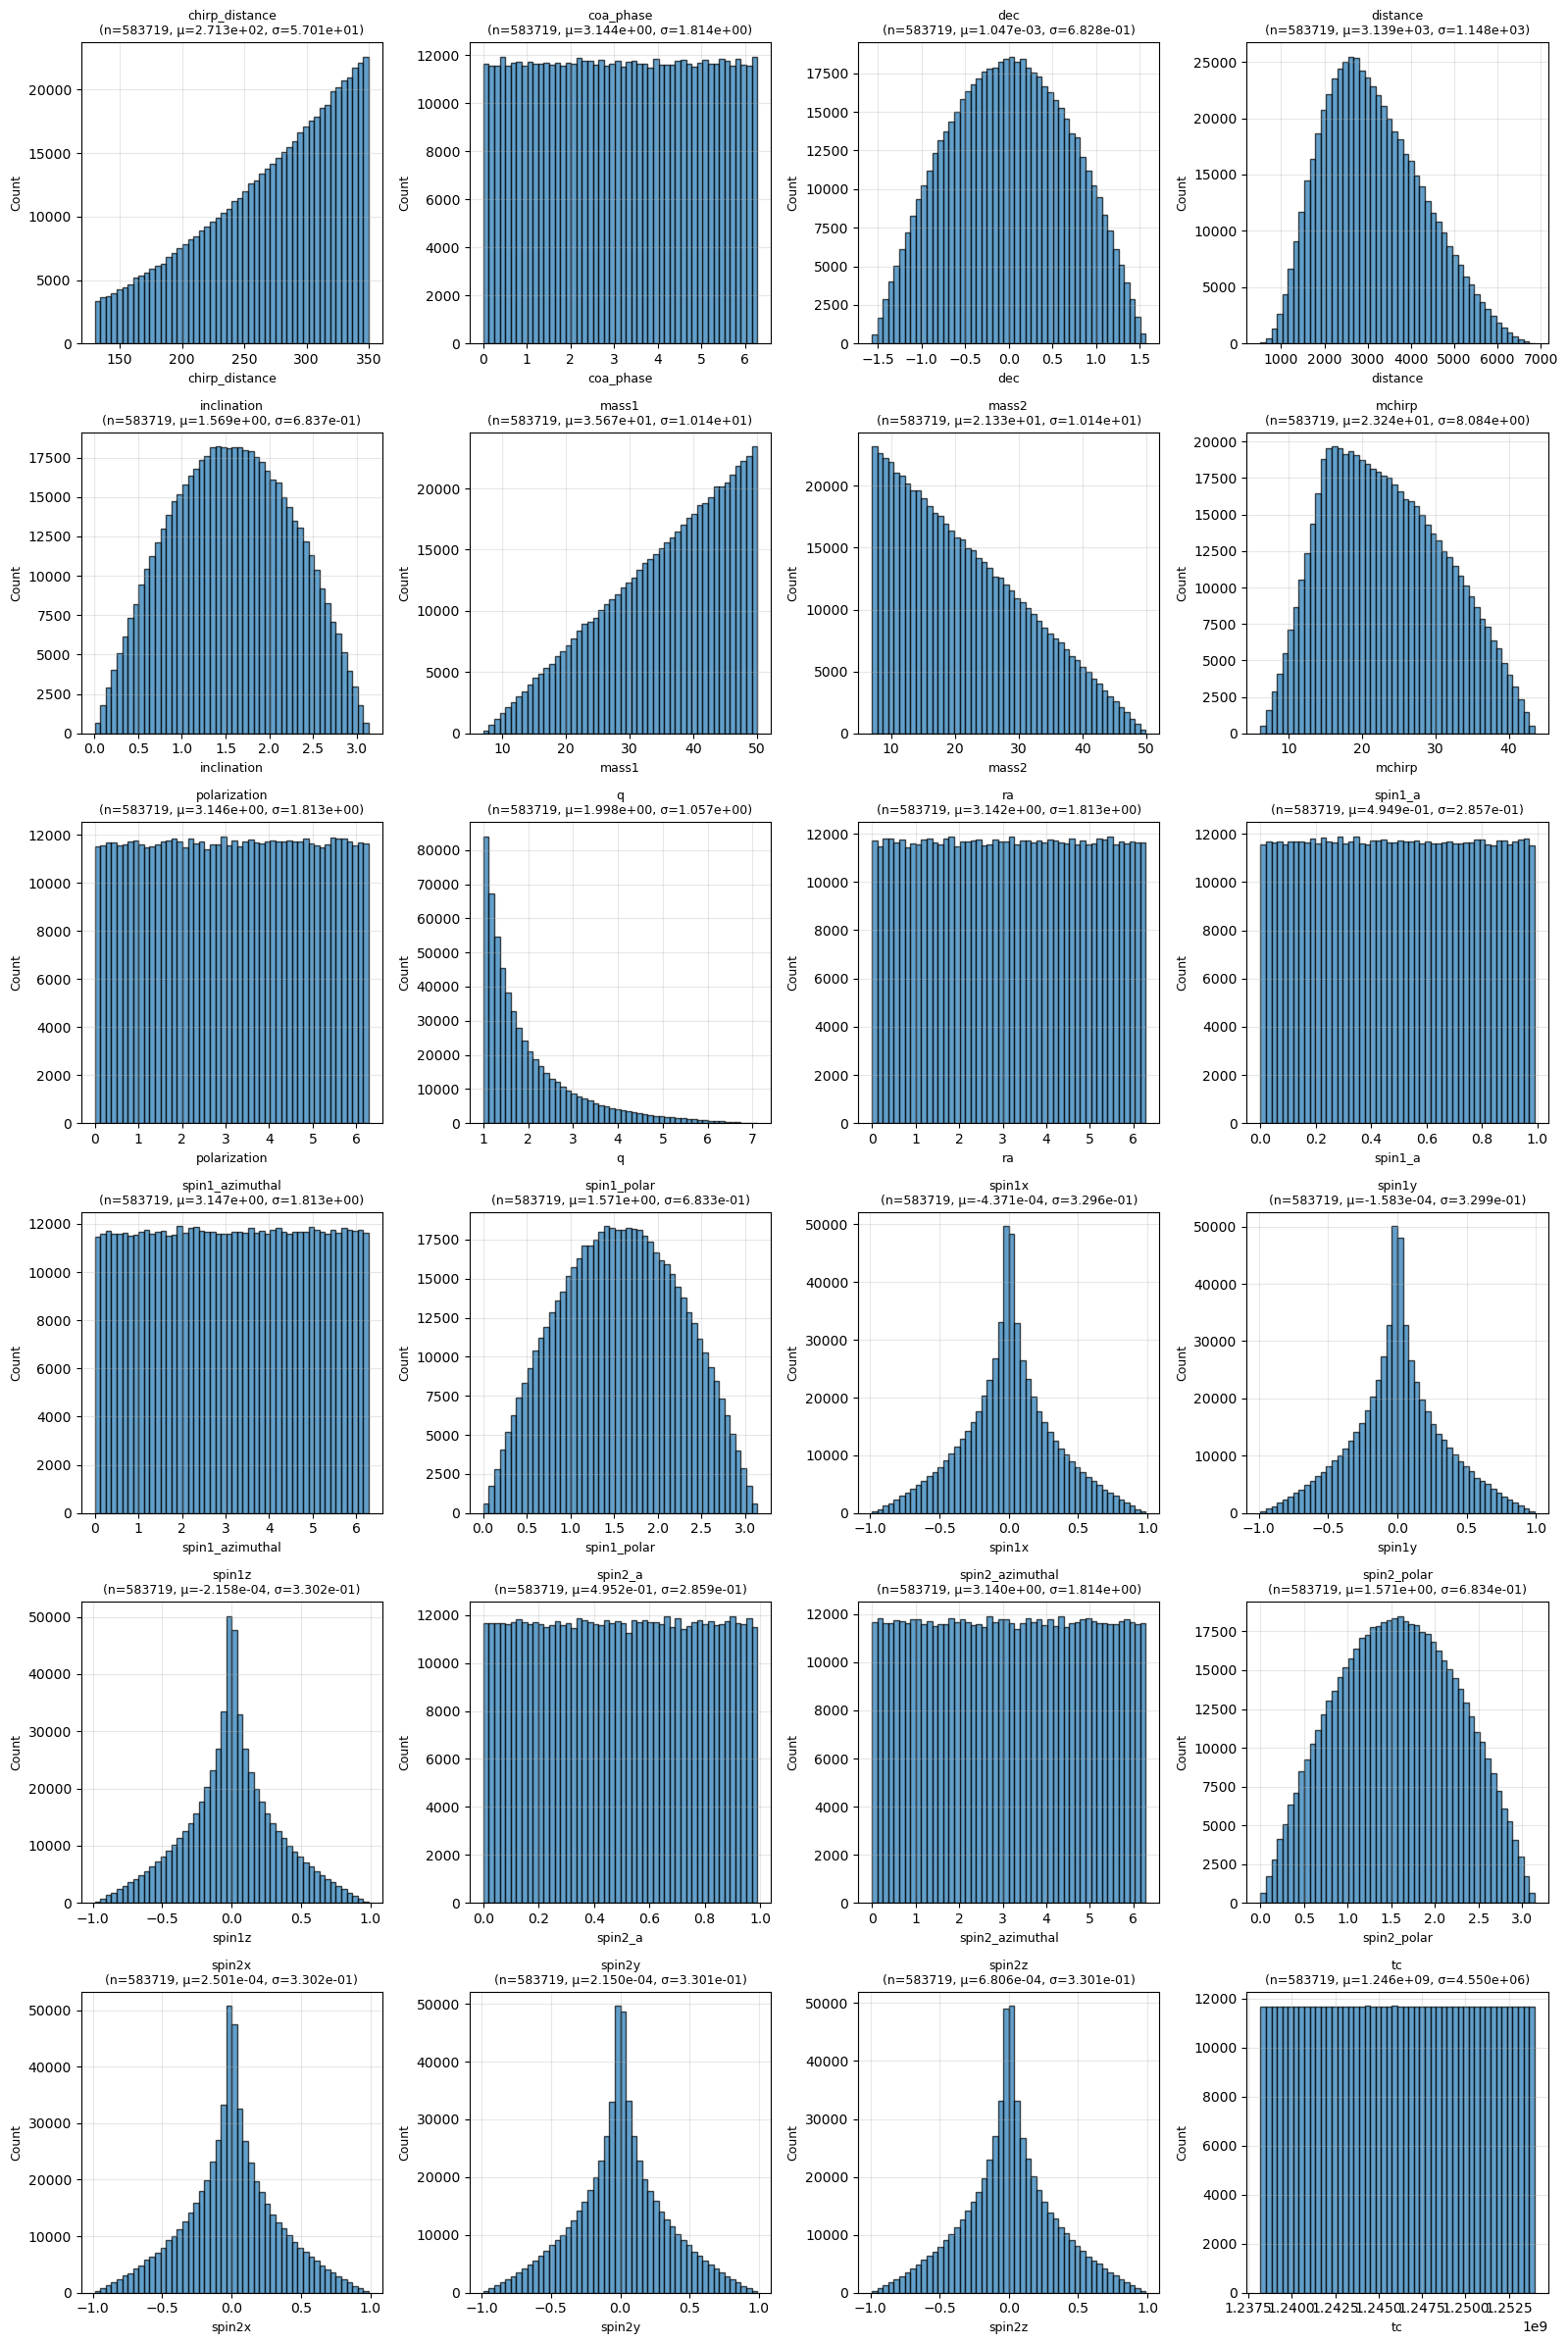
--- Summary Statistics ---
       chirp_distance      coa_phase            dec       distance  \
count   583719.000000  583719.000000  583719.000000  583719.000000
mean       271.326850       3.143846       0.001047    3138.842849
std         57.008161       1.814026       0.682806    1147.990595
min        130.000207       0.000007      -1.569759     523.029332
25%        231.179891       1.574355      -0.522210    2262.348332
50%        282.296822       3.142432       0.002489    3008.966581
75%        319.652796       4.714671       0.524785    3922.014985
max        349.999629       6.283183       1.569751    6851.224623

         inclination          mass1          mass2         mchirp  \
count  583719.000000  583719.000000  583719.000000  583719.000000
mean        1.569268      35.674158      21.325516      23.243739
std         0.683735      10.138100      10.137630       8.084028
min         0.002767       7.024685       7.000021       6.114797
25%         1.045320      28.495096      12.744603      16.726956
50%         1.567735      37.420965      19.580138      22.535647
75%         2.093216      44.240840      28.493565      29.276000
max         3.138795      49.999987      49.935309      43.485856

        polarization              q  ...         spin1x         spin1y  \
count  583719.000000  583719.000000  ...  583719.000000  583719.000000
mean        3.146388       1.997667  ...      -0.000437      -0.000158
std         1.812646       1.057465  ...       0.329644       0.329933
min         0.000003       1.000000  ...      -0.986460      -0.987496
25%         1.581001       1.233750  ...      -0.185706      -0.185333
50%         3.149685       1.618333  ...      -0.000040      -0.000271
75%         4.714048       2.396046  ...       0.183724       0.184858
max         6.283180       7.105841  ...       0.987745       0.988559

              spin1z       spin2_a  spin2_azimuthal    spin2_polar  \
count  583719.000000  5.837190e+05    583719.000000  583719.000000
mean       -0.000216  4.952085e-01         3.140437       1.570603
std         0.330221  2.858603e-01         1.814117       0.683370
min        -0.985549  2.104341e-08         0.000009       0.001958
25%        -0.184656  2.477089e-01         1.570864       1.047942
50%        -0.000117  4.950774e-01         3.138481       1.569784
75%         0.184442  7.427727e-01         4.713438       2.093537
max         0.987048  9.899979e-01         6.283181       3.140090

              spin2x         spin2y         spin2z            tc
count  583719.000000  583719.000000  583719.000000  5.837190e+05
mean        0.000250       0.000215       0.000681  1.246086e+09
std         0.330180       0.330110       0.330085  4.549745e+06
min        -0.986508      -0.987843      -0.988642  1.238205e+09
25%        -0.184968      -0.184696      -0.183895  1.242145e+09
50%         0.000026       0.000101       0.000111  1.246086e+09
75%         0.185009       0.185600       0.185436  1.250026e+09
max         0.989042       0.988533       0.988380  1.253966e+09

[8 rows x 24 columns]
f.close()
print("Closed file.")
Closed file.
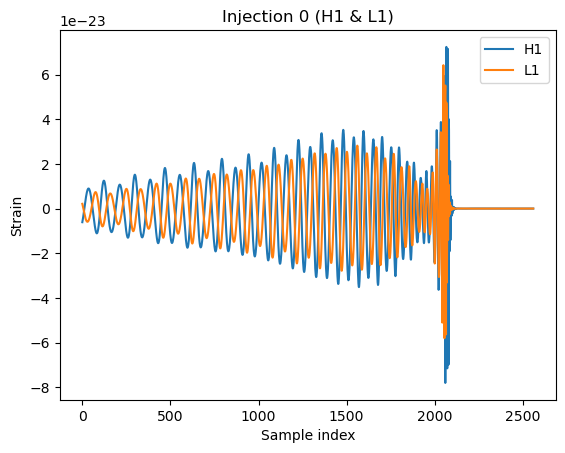
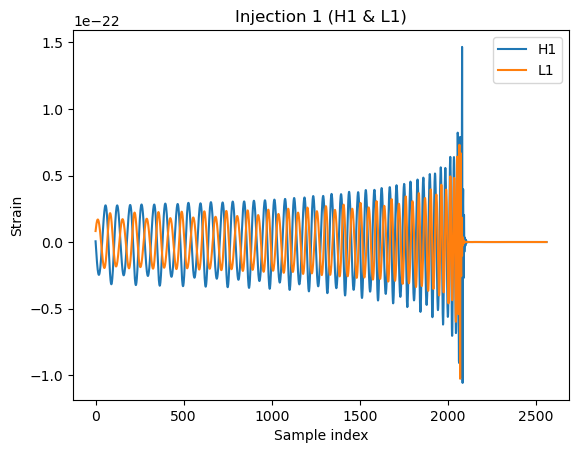
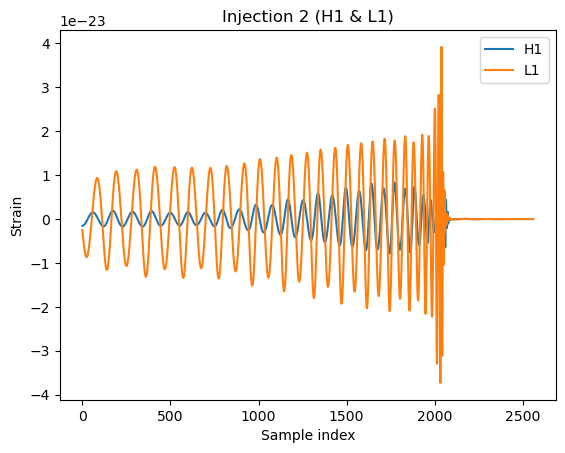
5) INSPECTIONS OF INDIVIDUAL WAVEFORMS IN npy FILE#
# Inspect the injections_train.npy file
import numpy as np
import matplotlib.pyplot as plt

NPY_PATH = "data7200/injections_train.npy"
arr = np.load(NPY_PATH, mmap_mode='r')
print(f"Loaded {NPY_PATH}")
print("Shape:", arr.shape)
print("Dtype:", arr.dtype)

# Show a summary of the first few waveforms
n_show = min(5, arr.shape[0])
for i in range(n_show):
    print(f"Waveform {i}: shape={arr[i].shape}")
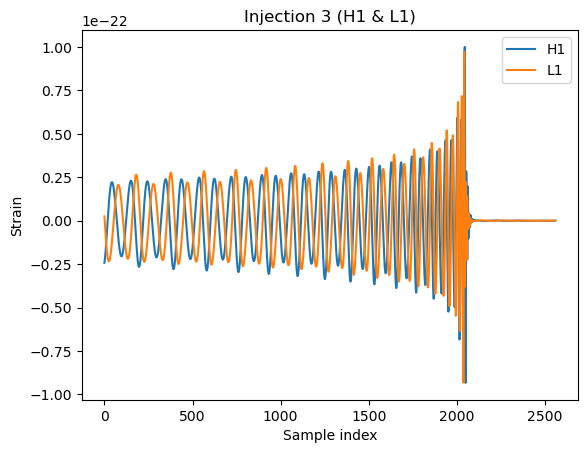
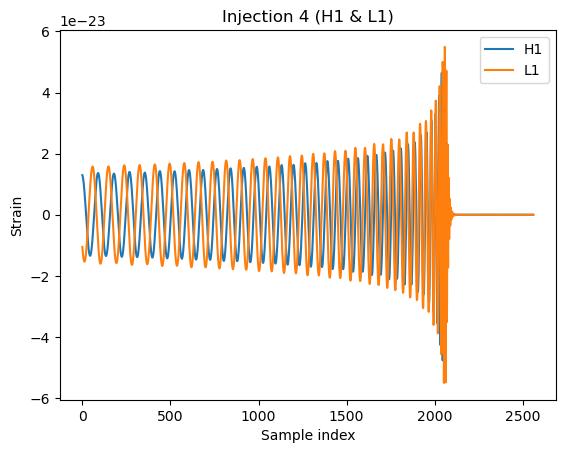
    plt.figure()
    plt.plot(arr[i, 0], label='H1')
    plt.plot(arr[i, 1], label='L1')
    plt.title(f"Injection {i} (H1 & L1)")
    plt.xlabel("Sample index")
    plt.ylabel("Strain")
    plt.legend()
    plt.show()

# Print basic stats for all waveforms
print("Min:", np.nanmin(arr))
print("Max:", np.nanmax(arr))
print("Mean:", np.nanmean(arr))
print("Std:", np.nanstd(arr))
Loaded data7200/injections_train.npy
Shape: (267, 2, 2560)
Dtype: float32
Waveform 0: shape=(2, 2560)
Waveform 1: shape=(2, 2560)
Waveform 2: shape=(2, 2560)
Waveform 3: shape=(2, 2560)
Waveform 4: shape=(2, 2560)
Min: -2.569623e-22
Max: 2.6662774e-22
Mean: -2.0848448e-27
Std: 0.0